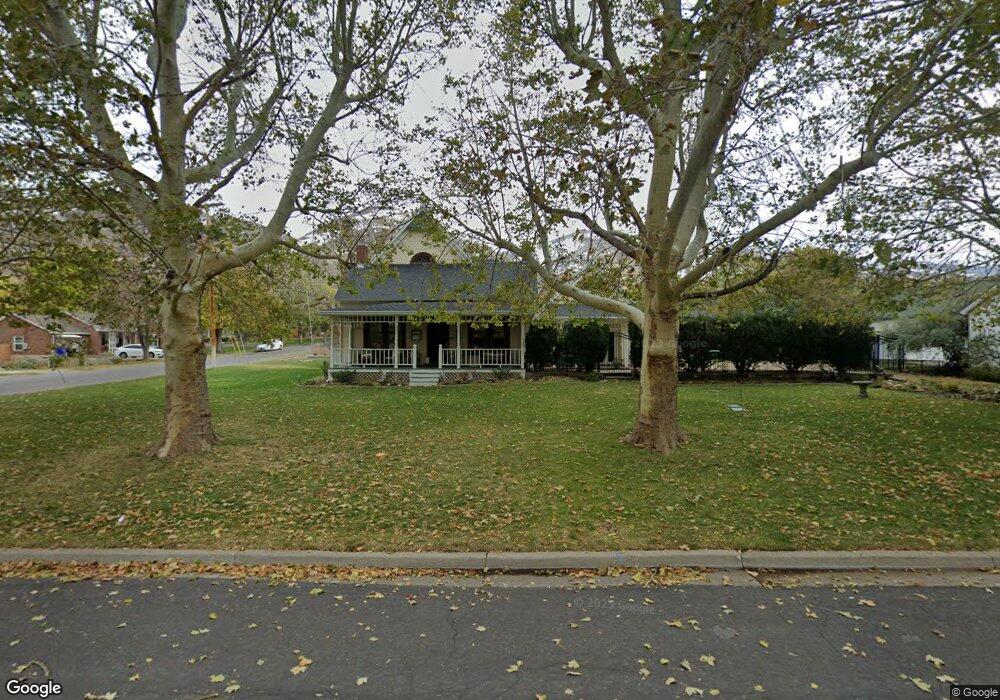
19 S 200 E Centerville, UT 84014
Estimated Value: $575,000 - $638,000
3
Beds
3
Baths
2,946
Sq Ft
$208/Sq Ft
Est. Value
About This Home
This home is located at 19 S 200 E, Centerville, UT 84014 and is currently estimated at $611,320, approximately $207 per square foot. 19 S 200 E is a home located in Davis County with nearby schools including Centerville Elementary, Centerville Jr High, and Viewmont High School.
Ownership History
Date
Name
Owned For
Owner Type
Purchase Details
Closed on
Jun 25, 2018
Sold by
Yarman Nancy Lees and Yarman John Allan
Bought by
Yarman Nancy L and Yarman Living Trust
Current Estimated Value
Purchase Details
Closed on
Dec 18, 2008
Sold by
Yarman Nancy L
Bought by
Yarman Nancy L and Yarman John Allan
Purchase Details
Closed on
Aug 29, 2007
Sold by
Yarman John A
Bought by
Yarman Nancy L
Purchase Details
Closed on
Sep 6, 2006
Sold by
Yarman John Allan
Bought by
Yarman John Allan and Yarman Nancy Lees
Home Financials for this Owner
Home Financials are based on the most recent Mortgage that was taken out on this home.
Original Mortgage
$199,000
Interest Rate
6.67%
Mortgage Type
Purchase Money Mortgage
Create a Home Valuation Report for This Property
The Home Valuation Report is an in-depth analysis detailing your home's value as well as a comparison with similar homes in the area
Purchase History
| Date | Buyer | Sale Price | Title Company |
|---|---|---|---|
| Yarman Nancy L | -- | None Available | |
| Yarman Nancy L | -- | None Available | |
| Yarman Nancy L | -- | None Available | |
| Yarman John Allan | -- | First American Title | |
| Yarman John Allan | -- | First American Title |
Source: Public Records
Mortgage History
| Date | Status | Borrower | Loan Amount |
|---|---|---|---|
| Previous Owner | Yarman John Allan | $199,000 |
Source: Public Records
Tax History
| Year | Tax Paid | Tax Assessment Tax Assessment Total Assessment is a certain percentage of the fair market value that is determined by local assessors to be the total taxable value of land and additions on the property. | Land | Improvement |
|---|---|---|---|---|
| 2025 | $3,139 | $300,300 | $172,635 | $127,665 |
| 2024 | $3,030 | $294,800 | $159,618 | $135,182 |
| 2023 | $2,947 | $518,000 | $255,969 | $262,031 |
| 2022 | $3,091 | $299,200 | $130,436 | $168,764 |
| 2021 | $2,858 | $431,000 | $205,798 | $225,202 |
| 2020 | $2,328 | $351,000 | $198,528 | $152,472 |
| 2019 | $2,255 | $332,000 | $187,505 | $144,495 |
| 2018 | $2,104 | $306,000 | $173,374 | $132,626 |
| 2016 | $1,692 | $136,785 | $64,825 | $71,960 |
| 2015 | $1,661 | $126,665 | $64,825 | $61,840 |
| 2014 | $1,910 | $149,035 | $64,825 | $84,210 |
| 2013 | -- | $121,851 | $45,375 | $76,476 |
Source: Public Records
Map
Nearby Homes
Your Personal Tour Guide
Ask me questions while you tour the home.