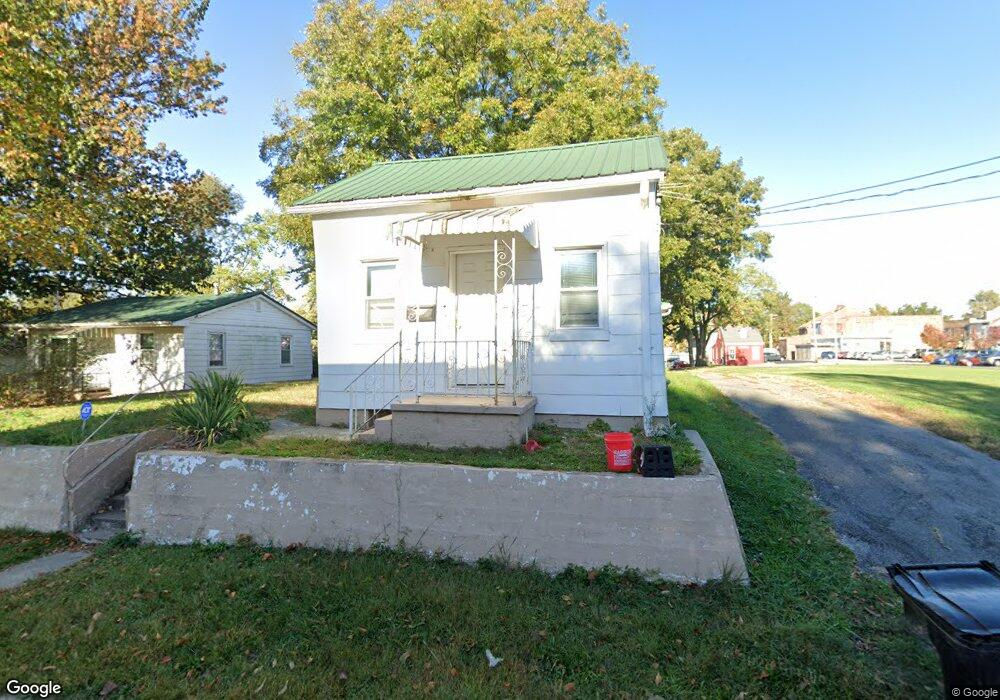
19 S 9th St Belleville, IL 62220
Estimated Value: $64,000 - $95,000
2
Beds
1
Bath
878
Sq Ft
$97/Sq Ft
Est. Value
About This Home
This home is located at 19 S 9th St, Belleville, IL 62220 and is currently estimated at $85,064, approximately $96 per square foot. 19 S 9th St is a home located in St. Clair County with nearby schools including Henry Raab Elementary School, Central Jr High School, and Governor French Academy.
Ownership History
Date
Name
Owned For
Owner Type
Purchase Details
Closed on
May 29, 2024
Sold by
Trentman Michelle M and Southern Investment Land Trust Southern Inves
Bought by
Shaneys Capital Ventures Llc
Current Estimated Value
Home Financials for this Owner
Home Financials are based on the most recent Mortgage that was taken out on this home.
Original Mortgage
$66,000
Outstanding Balance
$64,937
Interest Rate
7.1%
Mortgage Type
Commercial
Estimated Equity
$20,127
Purchase Details
Closed on
May 11, 2011
Sold by
Frierdich Gary and Frierdich Gary L
Bought by
Southern Investment Land Trust
Purchase Details
Closed on
Sep 26, 2002
Sold by
Neumeyer Steve and Neumeyer Maria L
Bought by
Neumeyer Maria L
Create a Home Valuation Report for This Property
The Home Valuation Report is an in-depth analysis detailing your home's value as well as a comparison with similar homes in the area
Home Values in the Area
Average Home Value in this Area
Purchase History
| Date | Buyer | Sale Price | Title Company |
|---|---|---|---|
| Shaneys Capital Ventures Llc | $82,500 | Town & Country Title | |
| Southern Investment Land Trust | $23,000 | None Available | |
| Neumeyer Maria L | -- | -- |
Source: Public Records
Mortgage History
| Date | Status | Borrower | Loan Amount |
|---|---|---|---|
| Open | Shaneys Capital Ventures Llc | $66,000 |
Source: Public Records
Tax History
| Year | Tax Paid | Tax Assessment Tax Assessment Total Assessment is a certain percentage of the fair market value that is determined by local assessors to be the total taxable value of land and additions on the property. | Land | Improvement |
|---|---|---|---|---|
| 2024 | $2,099 | $23,865 | $3,853 | $20,012 |
| 2023 | $1,113 | $11,860 | $3,778 | $8,082 |
| 2022 | $1,022 | $10,677 | $3,401 | $7,276 |
| 2021 | $984 | $9,870 | $3,144 | $6,726 |
| 2020 | $957 | $12,660 | $2,973 | $9,687 |
| 2019 | $853 | $8,236 | $2,977 | $5,259 |
| 2018 | $834 | $8,058 | $2,913 | $5,145 |
| 2017 | $1,080 | $8,000 | $2,892 | $5,108 |
| 2016 | $1,322 | $14,579 | $2,831 | $11,748 |
| 2014 | $411 | $4,444 | $3,831 | $613 |
| 2013 | $1,446 | $4,508 | $3,886 | $622 |
Source: Public Records
Map
Nearby Homes
Your Personal Tour Guide
Ask me questions while you tour the home.