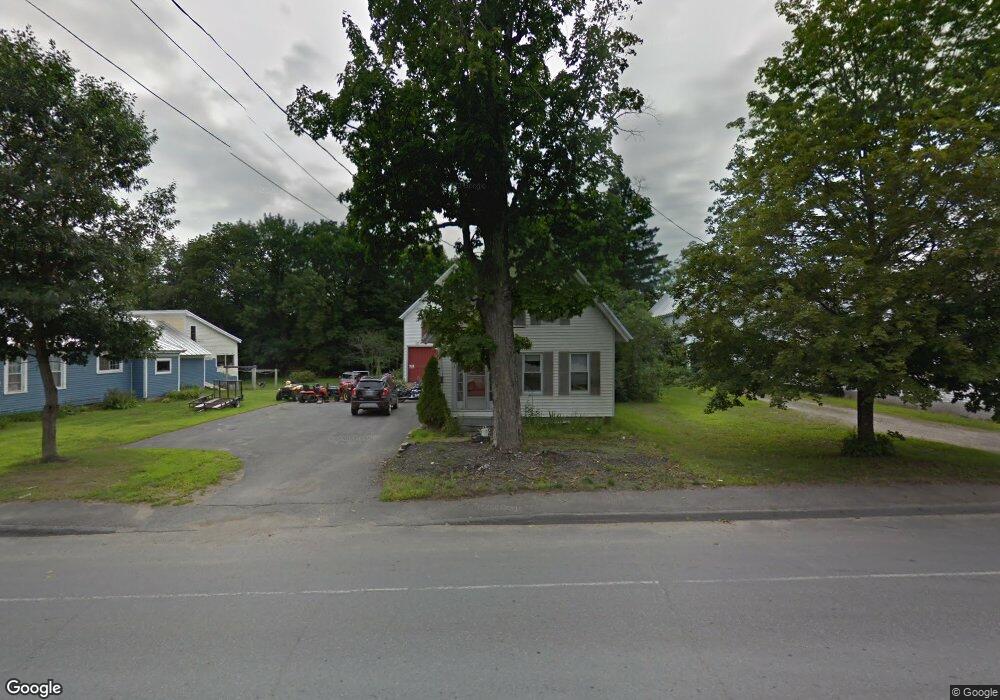
19 S Main St Strong, ME 04983
Estimated Value: $142,059 - $275,000
3
Beds
1
Bath
1,382
Sq Ft
$145/Sq Ft
Est. Value
About This Home
This home is located at 19 S Main St, Strong, ME 04983 and is currently estimated at $200,015, approximately $144 per square foot. 19 S Main St is a home located in Franklin County with nearby schools including Mt. Abram Regional High School.
Ownership History
Date
Name
Owned For
Owner Type
Purchase Details
Closed on
Feb 14, 2023
Sold by
Knox Elmer L and Knox Janette H
Bought by
Bracy Caleb
Current Estimated Value
Home Financials for this Owner
Home Financials are based on the most recent Mortgage that was taken out on this home.
Original Mortgage
$94,090
Outstanding Balance
$91,217
Interest Rate
6.48%
Mortgage Type
Purchase Money Mortgage
Estimated Equity
$108,798
Purchase Details
Closed on
Feb 1, 2010
Sold by
Shaw 2Nd Philip A and Fnma
Bought by
Federal National Mortgage Association
Purchase Details
Closed on
Jul 22, 2005
Sold by
Pillsbury Jeffrey S
Bought by
Shaw 2Nd Philip A
Home Financials for this Owner
Home Financials are based on the most recent Mortgage that was taken out on this home.
Original Mortgage
$71,200
Interest Rate
6.7%
Mortgage Type
Commercial
Create a Home Valuation Report for This Property
The Home Valuation Report is an in-depth analysis detailing your home's value as well as a comparison with similar homes in the area
Home Values in the Area
Average Home Value in this Area
Purchase History
| Date | Buyer | Sale Price | Title Company |
|---|---|---|---|
| Bracy Caleb | $97,000 | None Available | |
| Federal National Mortgage Association | -- | -- | |
| Shaw 2Nd Philip A | -- | -- |
Source: Public Records
Mortgage History
| Date | Status | Borrower | Loan Amount |
|---|---|---|---|
| Open | Bracy Caleb | $94,090 | |
| Previous Owner | Federal National Mortgage Association | $62,655 | |
| Previous Owner | Shaw 2Nd Philip A | $71,200 |
Source: Public Records
Tax History Compared to Growth
Tax History
| Year | Tax Paid | Tax Assessment Tax Assessment Total Assessment is a certain percentage of the fair market value that is determined by local assessors to be the total taxable value of land and additions on the property. | Land | Improvement |
|---|---|---|---|---|
| 2024 | $1,729 | $98,240 | $13,920 | $84,320 |
| 2023 | $1,572 | $98,240 | $13,920 | $84,320 |
| 2022 | $1,552 | $98,240 | $13,920 | $84,320 |
| 2021 | $1,621 | $98,240 | $13,920 | $84,320 |
| 2020 | $1,680 | $98,240 | $13,920 | $84,320 |
| 2019 | $1,749 | $98,240 | $13,920 | $84,320 |
| 2018 | $1,523 | $98,240 | $13,920 | $84,320 |
| 2017 | $1,415 | $98,240 | $13,920 | $84,320 |
| 2016 | $1,395 | $98,240 | $13,920 | $84,320 |
| 2015 | $1,444 | $98,240 | $13,920 | $84,320 |
| 2013 | $1,257 | $98,240 | $13,920 | $84,320 |
Source: Public Records
Map
Nearby Homes
- 18 N Main St
- 44 Norton Hill Rd
- 29 River St
- U03-68-C Tbd
- 83 Lambert Hill Rd
- 16 Whitetail Dr
- R-5 13-A Norton Hill Rd
- 22 W Freeman Rd
- 162.7 Collins Dr
- MR11 L35 Burbank Hill Rd
- 68 S Strong Rd
- 43 Brookside Ln
- 9 Beechnut Ridge
- Lot 4 Taylor Hill Rd
- 722 Farmington Rd
- Lot 12 Barker Rd
- 97 Lake St
- 4 Cousineaus Tory Hill Heights
- 94 New Vineyard Rd
- MR7 L31&37 Taylor Hill Rd