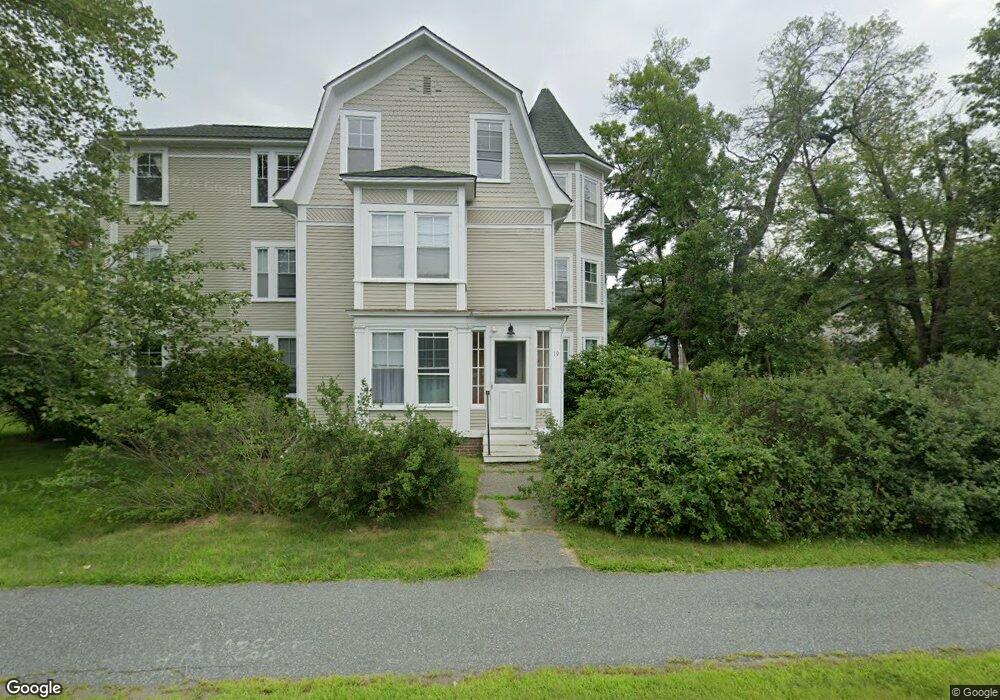
19 S Park St Unit 2 Hanover, NH 03755
Estimated Value: $424,747 - $562,000
2
Beds
1
Bath
1,243
Sq Ft
$393/Sq Ft
Est. Value
About This Home
This home is located at 19 S Park St Unit 2, Hanover, NH 03755 and is currently estimated at $488,687, approximately $393 per square foot. 19 S Park St Unit 2 is a home located in Grafton County with nearby schools including Bernice A. Ray School, Frances C. Richmond School, and Hanover High School.
Ownership History
Date
Name
Owned For
Owner Type
Purchase Details
Closed on
Apr 14, 2016
Sold by
Ramsey Eric L and Mcmahon Leo F
Bought by
Dong Kui and Huang Duo
Current Estimated Value
Home Financials for this Owner
Home Financials are based on the most recent Mortgage that was taken out on this home.
Original Mortgage
$190,200
Outstanding Balance
$147,998
Interest Rate
3.64%
Mortgage Type
Purchase Money Mortgage
Estimated Equity
$340,689
Purchase Details
Closed on
Dec 1, 2006
Sold by
Dartmouth College Tr
Bought by
Ramsey Eric L
Home Financials for this Owner
Home Financials are based on the most recent Mortgage that was taken out on this home.
Original Mortgage
$200,000
Interest Rate
6%
Mortgage Type
Adjustable Rate Mortgage/ARM
Create a Home Valuation Report for This Property
The Home Valuation Report is an in-depth analysis detailing your home's value as well as a comparison with similar homes in the area
Home Values in the Area
Average Home Value in this Area
Purchase History
| Date | Buyer | Sale Price | Title Company |
|---|---|---|---|
| Dong Kui | $237,800 | -- | |
| Dong Kui | $237,800 | -- | |
| Ramsey Eric L | $200,000 | -- | |
| Ramsey Eric L | $200,000 | -- | |
| Ramsey Eric L | $200,000 | -- |
Source: Public Records
Mortgage History
| Date | Status | Borrower | Loan Amount |
|---|---|---|---|
| Open | Ramsey Eric L | $190,200 | |
| Closed | Ramsey Eric L | $190,200 | |
| Previous Owner | Ramsey Eric L | $200,000 |
Source: Public Records
Tax History
| Year | Tax Paid | Tax Assessment Tax Assessment Total Assessment is a certain percentage of the fair market value that is determined by local assessors to be the total taxable value of land and additions on the property. | Land | Improvement |
|---|---|---|---|---|
| 2025 | $5,136 | $369,200 | $0 | $369,200 |
| 2024 | $4,881 | $253,300 | $0 | $253,300 |
| 2023 | $4,696 | $253,300 | $0 | $253,300 |
| 2022 | $4,506 | $253,300 | $0 | $253,300 |
| 2021 | $4,468 | $253,300 | $0 | $253,300 |
| 2020 | $4,780 | $236,500 | $0 | $236,500 |
| 2019 | $4,713 | $236,500 | $0 | $236,500 |
| 2018 | $4,548 | $236,500 | $0 | $236,500 |
| 2017 | $5,138 | $236,900 | $55,100 | $181,800 |
| 2016 | $5,044 | $236,900 | $55,100 | $181,800 |
| 2015 | $4,946 | $236,900 | $55,100 | $181,800 |
| 2014 | $4,745 | $236,900 | $55,100 | $181,800 |
| 2013 | -- | $236,900 | $55,100 | $181,800 |
| 2012 | $4,308 | $233,000 | $55,100 | $177,900 |
Source: Public Records
Map
Nearby Homes
- 1 O'Leary Ave
- 8 Fairview Ave
- 23 School St
- 20 Haskins Rd
- 85 Lebanon St
- 2 Hilton Field Ln
- 4 Occom Ridge
- 4 Haskins Rd
- 27 College Hill Rd
- 18 College Hill Rd Unit 18
- 16 College Hill Rd
- 9 Wyeth Rd
- 11 Gile Dr Unit 1B
- 15 Gile Dr Unit 3A
- 20 Greensboro Rd
- 0 and 2.5 Balch Hill Ln
- 4 Gile Dr Unit 2B
- 25 Pinewood Village Rd Unit 25
- 43 Gould Rd
- 3 Woodmore Dr
Your Personal Tour Guide
Ask me questions while you tour the home.