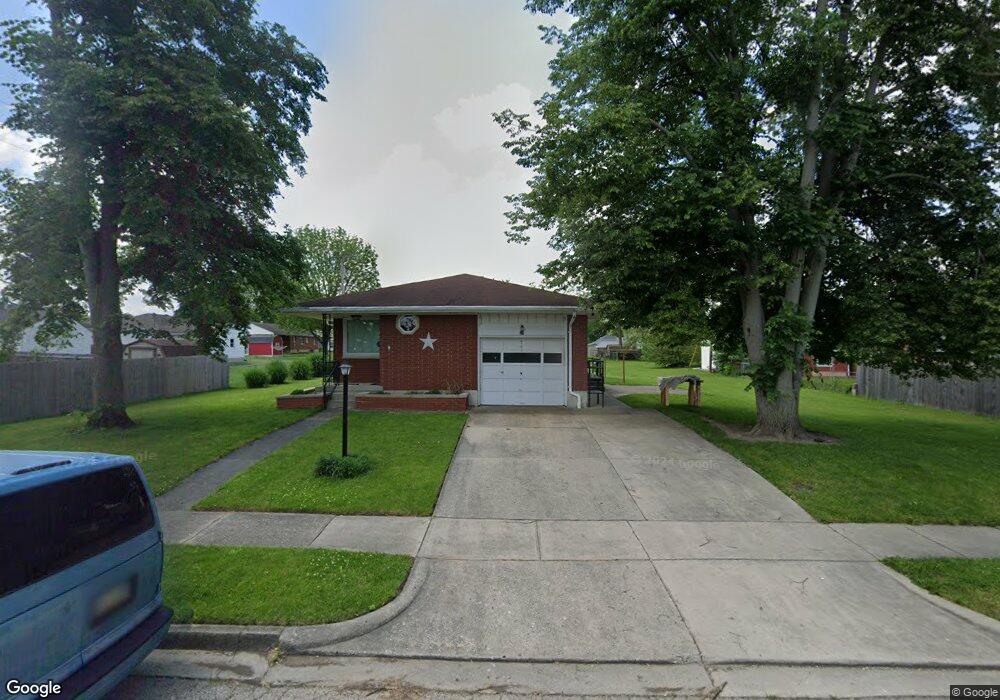
19 S Spring St West Milton, OH 45383
Estimated Value: $192,000 - $220,000
3
Beds
2
Baths
1,733
Sq Ft
$121/Sq Ft
Est. Value
About This Home
This home is located at 19 S Spring St, West Milton, OH 45383 and is currently estimated at $209,948, approximately $121 per square foot. 19 S Spring St is a home located in Miami County with nearby schools including Milton-Union Elementary School, Milton-Union Middle School, and Milton-Union High School.
Ownership History
Date
Name
Owned For
Owner Type
Purchase Details
Closed on
Aug 24, 2021
Sold by
Smith Alyssa K and Lightcap Alyssa K
Bought by
Smith Payton Wray
Current Estimated Value
Home Financials for this Owner
Home Financials are based on the most recent Mortgage that was taken out on this home.
Original Mortgage
$148,675
Outstanding Balance
$134,988
Interest Rate
2.8%
Mortgage Type
New Conventional
Estimated Equity
$74,960
Purchase Details
Closed on
Oct 28, 2016
Sold by
Coate Brandon A and Coate Erin E
Bought by
Lightcap Alyssa K
Purchase Details
Closed on
Jul 23, 2007
Sold by
Jackson John R
Bought by
Coate Brandon A and Coate Erin E
Purchase Details
Closed on
Mar 14, 2005
Sold by
Rose Owen Lee
Bought by
Jackson John R
Purchase Details
Closed on
Jun 11, 2004
Sold by
Hoover Constance Joy
Bought by
Hoover Paul E
Purchase Details
Closed on
Jun 1, 1987
Sold by
Rose Edward S
Bought by
Rose Edna M
Create a Home Valuation Report for This Property
The Home Valuation Report is an in-depth analysis detailing your home's value as well as a comparison with similar homes in the area
Home Values in the Area
Average Home Value in this Area
Purchase History
| Date | Buyer | Sale Price | Title Company |
|---|---|---|---|
| Smith Payton Wray | $156,500 | First American Mortgage Sln | |
| Lightcap Alyssa K | $123,500 | Attorney | |
| Coate Brandon A | $109,000 | -- | |
| Jackson John R | $30,833 | -- | |
| Hoover Paul E | -- | -- | |
| Rose Edna M | -- | -- |
Source: Public Records
Mortgage History
| Date | Status | Borrower | Loan Amount |
|---|---|---|---|
| Open | Smith Payton Wray | $148,675 |
Source: Public Records
Tax History Compared to Growth
Tax History
| Year | Tax Paid | Tax Assessment Tax Assessment Total Assessment is a certain percentage of the fair market value that is determined by local assessors to be the total taxable value of land and additions on the property. | Land | Improvement |
|---|---|---|---|---|
| 2024 | $1,963 | $52,190 | $10,470 | $41,720 |
| 2023 | $1,963 | $52,190 | $10,470 | $41,720 |
| 2022 | $1,985 | $52,190 | $10,470 | $41,720 |
| 2021 | $1,761 | $40,150 | $8,050 | $32,100 |
| 2020 | $1,766 | $40,150 | $8,050 | $32,100 |
| 2019 | $1,775 | $40,150 | $8,050 | $32,100 |
| 2018 | $1,456 | $30,740 | $8,090 | $22,650 |
| 2017 | $1,456 | $30,740 | $8,090 | $22,650 |
| 2016 | $1,394 | $30,740 | $8,090 | $22,650 |
| 2015 | $1,382 | $30,100 | $7,910 | $22,190 |
| 2014 | $1,382 | $30,100 | $7,910 | $22,190 |
| 2013 | $1,330 | $30,100 | $7,910 | $22,190 |
Source: Public Records
Map
Nearby Homes
- 129 Spring St
- 173 W Hamilton St
- 173 Hamilton St
- 301 N Spring St
- 323 Poplar St
- 207 Palm Ct
- 224 Locust Ln
- 111 Hayes St
- 125 S Miami St
- 140 Washington St
- 216 N Miami St
- 634 S Main St
- 16 Duerr Dr
- 488 N Jay St
- 490 N Jay St
- 484 N Main St
- 664 S Main St
- 7565 Ohio 571
- 0 Frederick-Garland Unit 934666
- 5400 Iddings Rd