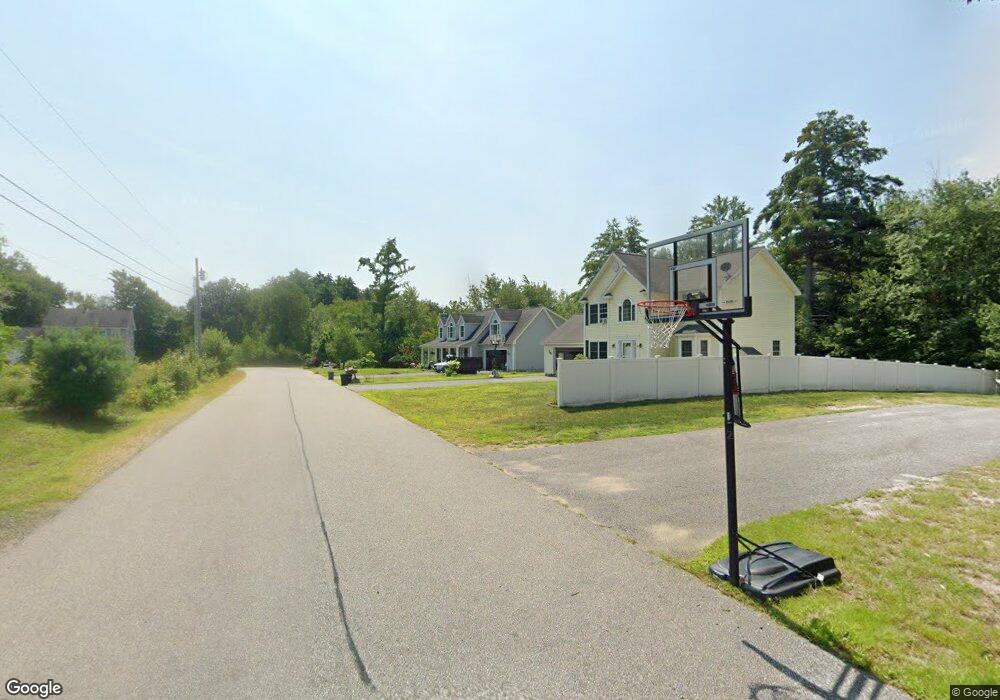
19 Seneca Ave Sanford, ME 04073
Estimated Value: $460,000 - $537,000
3
Beds
3
Baths
2,098
Sq Ft
$232/Sq Ft
Est. Value
About This Home
This home is located at 19 Seneca Ave, Sanford, ME 04073 and is currently estimated at $486,888, approximately $232 per square foot. 19 Seneca Ave is a home located in York County with nearby schools including Sanford Christian Academy and St Thomas Consolidated School.
Ownership History
Date
Name
Owned For
Owner Type
Purchase Details
Closed on
Apr 11, 2022
Sold by
Us Bank Na Tr
Bought by
Campobasso Edna and Campobasso Wayne
Current Estimated Value
Home Financials for this Owner
Home Financials are based on the most recent Mortgage that was taken out on this home.
Original Mortgage
$250,800
Outstanding Balance
$236,714
Interest Rate
4.72%
Mortgage Type
Purchase Money Mortgage
Estimated Equity
$250,174
Purchase Details
Closed on
May 25, 2017
Sold by
Campobasso Wayne
Bought by
Campobasso Edna
Purchase Details
Closed on
Oct 3, 2006
Sold by
Fagan Patrick F
Bought by
Campobasso Edna and Campobasso Wayne
Home Financials for this Owner
Home Financials are based on the most recent Mortgage that was taken out on this home.
Original Mortgage
$332,500
Interest Rate
10%
Mortgage Type
Adjustable Rate Mortgage/ARM
Create a Home Valuation Report for This Property
The Home Valuation Report is an in-depth analysis detailing your home's value as well as a comparison with similar homes in the area
Home Values in the Area
Average Home Value in this Area
Purchase History
| Date | Buyer | Sale Price | Title Company |
|---|---|---|---|
| Campobasso Edna | -- | None Available | |
| Campobasso Edna | -- | -- | |
| Campobasso Edna | -- | -- |
Source: Public Records
Mortgage History
| Date | Status | Borrower | Loan Amount |
|---|---|---|---|
| Open | Campobasso Edna | $250,800 | |
| Previous Owner | Campobasso Edna | $332,500 |
Source: Public Records
Tax History Compared to Growth
Tax History
| Year | Tax Paid | Tax Assessment Tax Assessment Total Assessment is a certain percentage of the fair market value that is determined by local assessors to be the total taxable value of land and additions on the property. | Land | Improvement |
|---|---|---|---|---|
| 2024 | $6,755 | $418,500 | $45,700 | $372,800 |
| 2023 | $6,148 | $406,100 | $45,700 | $360,400 |
| 2022 | $6,402 | $432,600 | $45,700 | $386,900 |
| 2021 | $6,343 | $348,900 | $45,700 | $303,200 |
| 2020 | $5,981 | $296,700 | $45,700 | $251,000 |
| 2019 | $5,699 | $275,300 | $45,700 | $229,600 |
| 2018 | $5,448 | $263,400 | $45,700 | $217,700 |
| 2017 | $5,166 | $249,100 | $45,700 | $203,400 |
| 2016 | $5,292 | $232,700 | $45,600 | $187,100 |
| 2015 | $5,448 | $247,200 | $53,400 | $193,800 |
| 2014 | $5,440 | $247,500 | $53,700 | $193,800 |
| 2013 | -- | $251,600 | $53,700 | $197,900 |
Source: Public Records
Map
Nearby Homes
- 11 Glen St
- 1023 Main St
- 40 School St
- 24 Twombley Rd
- 5 Shaw St
- 0 Main St Unit 1610912
- 126 Jackson St
- 19 Bodwell St Unit 9
- 19 Bodwell St Unit 8
- 19 Bodwell St Unit 7
- 19 Bodwell St Unit 6
- 19 Bodwell St Unit 5
- 19 Bodwell St Unit 4
- 19 Bodwell St Unit 3
- 19 Bodwell St Unit 2
- 19 Bodwell St Unit 1
- 18 Bodwell St
- 1 Kempton Terrace
- 13 Oxford St
- 58 Essex St