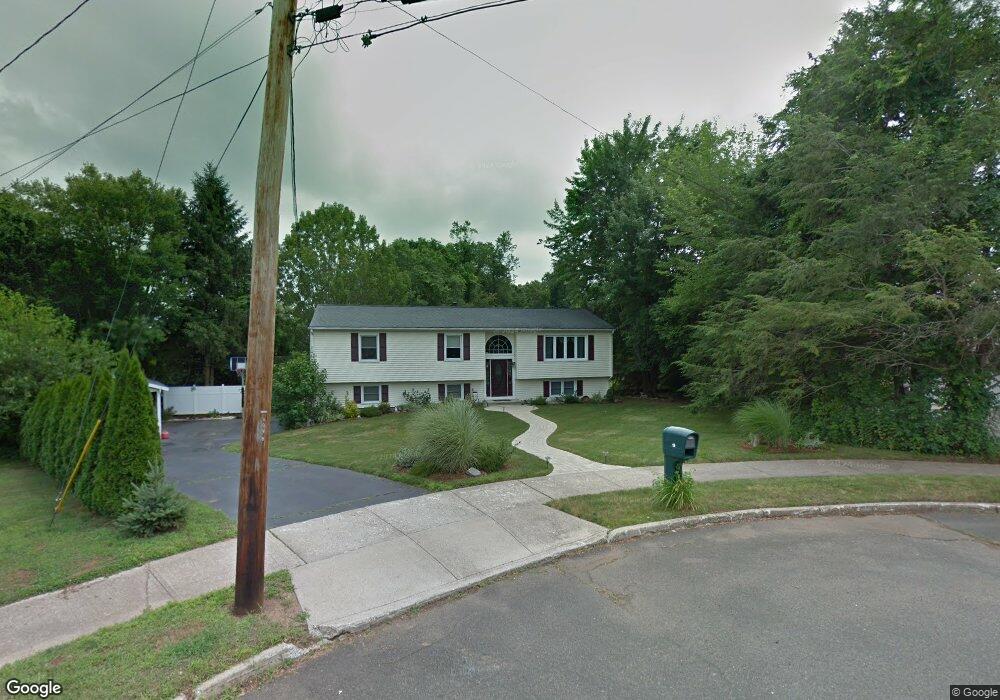
19 Southgate Ln North Haven, CT 06473
Estimated Value: $503,000 - $587,000
3
Beds
3
Baths
1,714
Sq Ft
$308/Sq Ft
Est. Value
About This Home
This home is located at 19 Southgate Ln, North Haven, CT 06473 and is currently estimated at $528,237, approximately $308 per square foot. 19 Southgate Ln is a home located in New Haven County with nearby schools including North Haven Middle School, North Haven High School, and Heritage Baptist Academy.
Ownership History
Date
Name
Owned For
Owner Type
Purchase Details
Closed on
Sep 9, 2014
Sold by
Steinman John R and Steinman Linda A
Bought by
Kuru Saadettin and Kuru Ayse
Current Estimated Value
Home Financials for this Owner
Home Financials are based on the most recent Mortgage that was taken out on this home.
Original Mortgage
$270,800
Outstanding Balance
$205,959
Interest Rate
4.12%
Mortgage Type
New Conventional
Estimated Equity
$322,278
Purchase Details
Closed on
Jun 25, 2002
Sold by
Saslow Steven M
Bought by
Steinman John R and Steinman Linda H
Home Financials for this Owner
Home Financials are based on the most recent Mortgage that was taken out on this home.
Original Mortgage
$190,000
Interest Rate
6.81%
Purchase Details
Closed on
Jan 16, 1996
Sold by
Munson Deborah P
Bought by
Saslow Steven M
Home Financials for this Owner
Home Financials are based on the most recent Mortgage that was taken out on this home.
Original Mortgage
$138,000
Interest Rate
7.31%
Mortgage Type
Unknown
Create a Home Valuation Report for This Property
The Home Valuation Report is an in-depth analysis detailing your home's value as well as a comparison with similar homes in the area
Home Values in the Area
Average Home Value in this Area
Purchase History
| Date | Buyer | Sale Price | Title Company |
|---|---|---|---|
| Kuru Saadettin | $338,500 | -- | |
| Steinman John R | $255,000 | -- | |
| Saslow Steven M | $160,000 | -- |
Source: Public Records
Mortgage History
| Date | Status | Borrower | Loan Amount |
|---|---|---|---|
| Open | Saslow Steven M | $270,800 | |
| Previous Owner | Saslow Steven M | $203,000 | |
| Previous Owner | Saslow Steven M | $190,000 | |
| Previous Owner | Saslow Steven M | $138,000 |
Source: Public Records
Tax History
| Year | Tax Paid | Tax Assessment Tax Assessment Total Assessment is a certain percentage of the fair market value that is determined by local assessors to be the total taxable value of land and additions on the property. | Land | Improvement |
|---|---|---|---|---|
| 2025 | $8,977 | $304,710 | $79,660 | $225,050 |
| 2024 | $7,741 | $223,480 | $79,690 | $143,790 |
| 2023 | $7,297 | $223,480 | $79,690 | $143,790 |
| 2022 | $6,863 | $223,480 | $79,690 | $143,790 |
| 2021 | $6,863 | $223,480 | $79,690 | $143,790 |
| 2020 | $6,865 | $223,480 | $79,690 | $143,790 |
| 2019 | $5,775 | $219,590 | $81,620 | $137,970 |
| 2018 | $6,847 | $219,590 | $81,620 | $137,970 |
| 2017 | $6,715 | $219,590 | $81,620 | $137,970 |
| 2016 | $6,704 | $219,590 | $81,620 | $137,970 |
| 2015 | $6,460 | $219,590 | $81,620 | $137,970 |
| 2014 | $6,464 | $230,020 | $95,270 | $134,750 |
Source: Public Records
Map
Nearby Homes
- 1866 Hartford Turnpike
- 78 Blue Hills Rd
- 10 Canterbury Way
- 100-150 Dodge Ave
- 44 Upper State St
- 1350 Mount Carmel Ave
- 45 Bradley St
- 36 Corey Rd
- 1450 Mount Carmel Ave
- 70 Scrub Oak Rd
- 26 Susan Ln
- 50 Bassett Rd
- 6 Carriage Dr
- 101 Pool Rd
- 9 Russell Rd
- 6 Liberty Terrace
- 22 Fieldstone Ct Unit 22
- 16 Fieldstone Ct
- 45 Pond Hill Lot 3 Rd
- 1400 Hartford Turnpike Unit 24
- 15 Southgate Ln
- 20 Southgate Ln
- 11 Southgate Ln
- 16 Southgate Ln
- 242 Upper State St
- 238 Upper State St
- 7 Southgate Ln
- 22 Jones Farm Rd
- 10 Southgate Ln
- 230 Upper State St
- 19 Jones Farm Rd
- 246 Upper State St
- 18 Jones Farm Rd
- 1 Southgate Ln
- 234 Upper State St
- 2 Southgate Ln
- 15 Jones Farm Rd
- 14 Jones Farm Rd
- 262 Upper State St
- 226 Upper State St
Your Personal Tour Guide
Ask me questions while you tour the home.