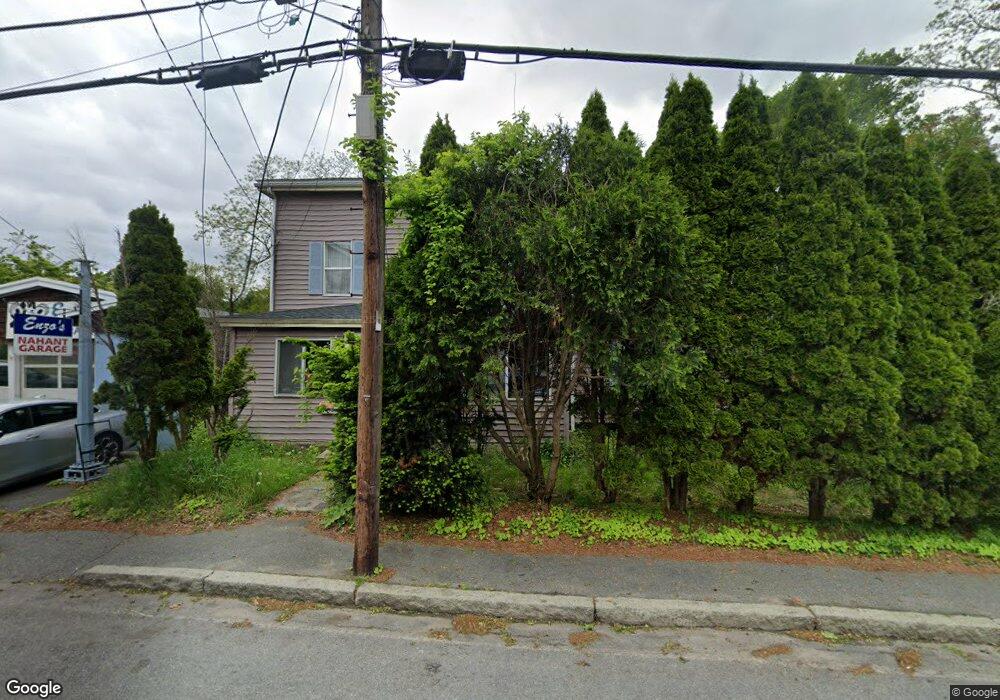
19 Spring Rd Nahant, MA 01908
Estimated Value: $861,000 - $1,130,000
3
Beds
2
Baths
1,168
Sq Ft
$824/Sq Ft
Est. Value
About This Home
This home is located at 19 Spring Rd, Nahant, MA 01908 and is currently estimated at $962,801, approximately $824 per square foot. 19 Spring Rd is a home located in Essex County with nearby schools including Johnson Elementary School, Swampscott Middle School, and Swampscott High School.
Ownership History
Date
Name
Owned For
Owner Type
Purchase Details
Closed on
Feb 26, 2004
Sold by
Donaghy Matthew T
Bought by
Jenkins Katherine S
Current Estimated Value
Home Financials for this Owner
Home Financials are based on the most recent Mortgage that was taken out on this home.
Original Mortgage
$333,700
Outstanding Balance
$155,738
Interest Rate
5.65%
Mortgage Type
Purchase Money Mortgage
Estimated Equity
$807,063
Purchase Details
Closed on
May 15, 1996
Sold by
Oconnor James C
Bought by
Donaghey Matthew T and Wyckoff Nancy
Create a Home Valuation Report for This Property
The Home Valuation Report is an in-depth analysis detailing your home's value as well as a comparison with similar homes in the area
Home Values in the Area
Average Home Value in this Area
Purchase History
| Date | Buyer | Sale Price | Title Company |
|---|---|---|---|
| Jenkins Katherine S | $420,000 | -- | |
| Jenkins Katherine S | $420,000 | -- | |
| Donaghey Matthew T | $90,000 | -- | |
| Donaghey Matthew T | $90,000 | -- |
Source: Public Records
Mortgage History
| Date | Status | Borrower | Loan Amount |
|---|---|---|---|
| Open | Donaghey Matthew T | $333,700 | |
| Closed | Donaghey Matthew T | $333,700 | |
| Previous Owner | Donaghey Matthew T | $175,000 |
Source: Public Records
Tax History
| Year | Tax Paid | Tax Assessment Tax Assessment Total Assessment is a certain percentage of the fair market value that is determined by local assessors to be the total taxable value of land and additions on the property. | Land | Improvement |
|---|---|---|---|---|
| 2025 | $7,611 | $831,800 | $500,800 | $331,000 |
| 2024 | $7,351 | $810,500 | $479,500 | $331,000 |
| 2023 | $6,755 | $743,100 | $426,200 | $316,900 |
| 2022 | $6,330 | $646,600 | $362,300 | $284,300 |
| 2021 | $6,383 | $607,300 | $341,000 | $266,300 |
| 2020 | $5,998 | $546,800 | $319,700 | $227,100 |
| 2019 | $5,466 | $501,000 | $298,400 | $202,600 |
| 2018 | $5,085 | $496,100 | $298,400 | $197,700 |
| 2017 | $5,195 | $496,200 | $298,400 | $197,800 |
| 2016 | $4,742 | $450,800 | $261,100 | $189,700 |
| 2015 | $4,719 | $432,100 | $242,400 | $189,700 |
| 2014 | $4,618 | $418,700 | $220,600 | $198,100 |
Source: Public Records
Map
Nearby Homes
- 1 Goddard Dr
- 30 Sherman Ave
- 183 Bass Point Rd
- 66 Ocean St
- 9 Little Nahant Rd
- 162 Willow Rd Unit 11
- 51 Cliff St
- 1 Carey Cir Unit 409
- 191 N Shore Rd
- 123 Mills Ave
- 11 Archer Ave
- 98 Lynnway
- 12 Chancery Ct Unit 404
- 31 Mills Ave
- 154 Lynnway Unit 210
- 154 Lynnway Unit 205
- 103 Nahant St Unit 4
- 285 Lynn Shore Dr Unit 205
- 285 Lynn Shore Dr Unit 203
- 285 Lynn Shore Dr Unit 304
Your Personal Tour Guide
Ask me questions while you tour the home.