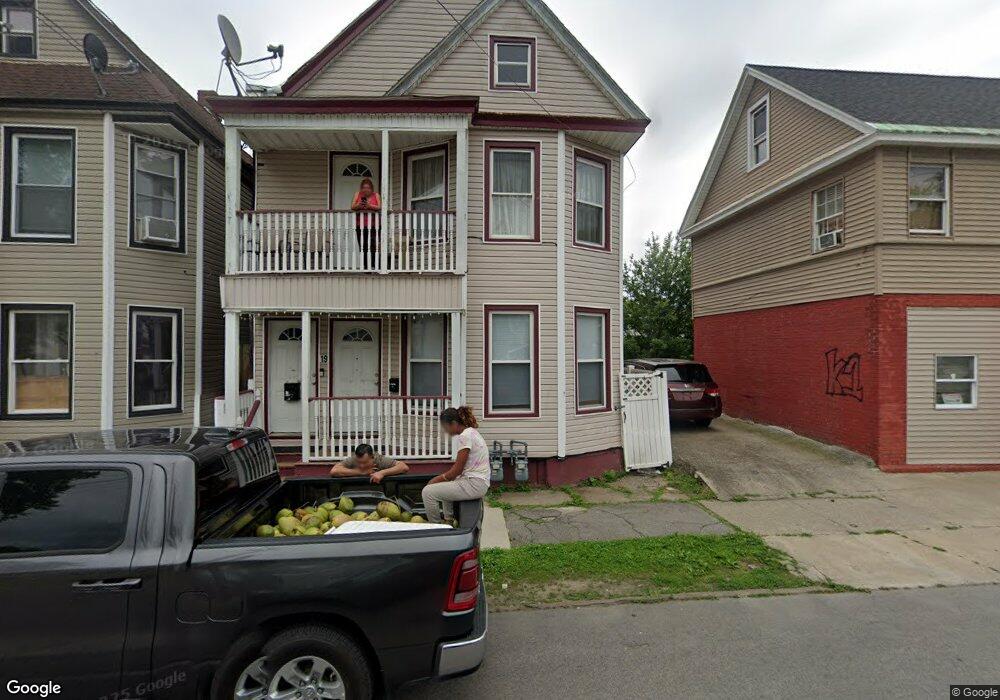
19 Steuben St Schenectady, NY 12307
Hamilton Hill NeighborhoodEstimated Value: $148,470 - $282,000
4
Beds
2
Baths
1,996
Sq Ft
$112/Sq Ft
Est. Value
About This Home
This home is located at 19 Steuben St, Schenectady, NY 12307 and is currently estimated at $223,618, approximately $112 per square foot. 19 Steuben St is a home located in Schenectady County with nearby schools including Martin Luther King School, Oneida Middle School, and Schenectady High School.
Ownership History
Date
Name
Owned For
Owner Type
Purchase Details
Closed on
Apr 27, 2023
Sold by
Sparzak Artur and Sparzak Hiemwantie
Bought by
Khemraj Niranjan and Khemraj Diane Niranjan
Current Estimated Value
Purchase Details
Closed on
Apr 29, 2022
Sold by
Sparzak Hiemwantie
Bought by
Sparzak Hiemwantie and Changoor Lakeram
Purchase Details
Closed on
Mar 19, 2008
Sold by
Beria David
Bought by
Sparzak Hiemwantie
Purchase Details
Closed on
Sep 6, 2002
Sold by
Realestate Intellgnc Corp
Bought by
Mohammed Shaffie
Purchase Details
Closed on
Nov 3, 1999
Sold by
Holloway Tony
Bought by
Real Estate Intelligence Corp
Purchase Details
Closed on
Jul 13, 1999
Sold by
Digiuseppe Brian
Bought by
Holloway Tony
Purchase Details
Closed on
Apr 13, 1999
Sold by
Secretary Of Housing & Ur Ban
Bought by
Digiuseppe Brian L
Purchase Details
Closed on
Oct 9, 1998
Purchase Details
Closed on
Jun 5, 1996
Sold by
Dept Of Hud
Bought by
Tocco Todd J and Tocco Sharon
Purchase Details
Closed on
Dec 5, 1994
Create a Home Valuation Report for This Property
The Home Valuation Report is an in-depth analysis detailing your home's value as well as a comparison with similar homes in the area
Home Values in the Area
Average Home Value in this Area
Purchase History
| Date | Buyer | Sale Price | Title Company |
|---|---|---|---|
| Khemraj Niranjan | $145,000 | Chicago Title | |
| Sparzak Hiemwantie | -- | None Listed On Document | |
| Sparzak Hiemwantie | -- | -- | |
| Mohammed Shaffie | $12,000 | -- | |
| Real Estate Intelligence Corp | -- | Richard Brown | |
| Holloway Tony | $30,000 | Richard Brown | |
| Digiuseppe Brian L | $1,000 | -- | |
| Digiuseppe Brian L | -- | -- | |
| -- | $41,898 | -- | |
| Tocco Todd J | $6,800 | -- | |
| -- | $38,507 | -- |
Source: Public Records
Tax History Compared to Growth
Tax History
| Year | Tax Paid | Tax Assessment Tax Assessment Total Assessment is a certain percentage of the fair market value that is determined by local assessors to be the total taxable value of land and additions on the property. | Land | Improvement |
|---|---|---|---|---|
| 2024 | $3,874 | $64,200 | $9,600 | $54,600 |
| 2023 | $37 | $64,200 | $9,600 | $54,600 |
| 2022 | $3,623 | $64,200 | $9,600 | $54,600 |
| 2021 | $1,880 | $64,200 | $9,600 | $54,600 |
| 2020 | $3,519 | $64,200 | $9,600 | $54,600 |
| 2019 | $2,189 | $64,200 | $9,600 | $54,600 |
| 2018 | $3,551 | $64,200 | $9,600 | $54,600 |
| 2017 | $3,237 | $64,200 | $9,600 | $54,600 |
| 2016 | $3,638 | $64,200 | $9,600 | $54,600 |
| 2015 | -- | $64,200 | $9,600 | $54,600 |
| 2014 | -- | $64,200 | $9,600 | $54,600 |
Source: Public Records
Map
Nearby Homes