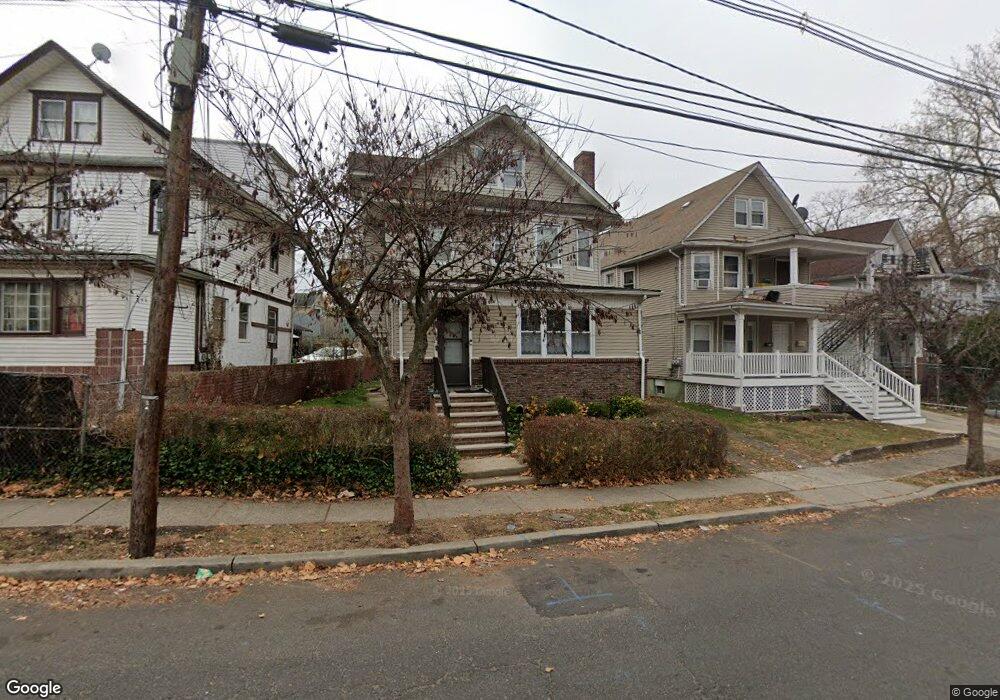
19 Sycamore Ave Unit 21 Plainfield, NJ 07060
Estimated Value: $355,279 - $455,000
Studio
--
Bath
1,472
Sq Ft
$275/Sq Ft
Est. Value
About This Home
This home is located at 19 Sycamore Ave Unit 21, Plainfield, NJ 07060 and is currently estimated at $404,820, approximately $275 per square foot. 19 Sycamore Ave Unit 21 is a home located in Union County with nearby schools including Charles H. Stillman Elementary School, Hubbard Middle School, and Plainfield High School.
Ownership History
Date
Name
Owned For
Owner Type
Purchase Details
Closed on
Mar 9, 2010
Sold by
Page Charles A
Bought by
Page Charles A and Page Sonia
Current Estimated Value
Home Financials for this Owner
Home Financials are based on the most recent Mortgage that was taken out on this home.
Original Mortgage
$145,000
Interest Rate
5.02%
Mortgage Type
Stand Alone First
Purchase Details
Closed on
Oct 27, 2005
Sold by
Butler Floyd
Bought by
Page Charles A
Home Financials for this Owner
Home Financials are based on the most recent Mortgage that was taken out on this home.
Original Mortgage
$155,000
Interest Rate
5.79%
Purchase Details
Closed on
Aug 26, 1998
Sold by
Butler Madeline
Bought by
Butler Floyd
Home Financials for this Owner
Home Financials are based on the most recent Mortgage that was taken out on this home.
Original Mortgage
$90,400
Interest Rate
6.9%
Create a Home Valuation Report for This Property
The Home Valuation Report is an in-depth analysis detailing your home's value as well as a comparison with similar homes in the area
Home Values in the Area
Average Home Value in this Area
Purchase History
| Date | Buyer | Sale Price | Title Company |
|---|---|---|---|
| Page Charles A | -- | Allied Title Llc | |
| Page Charles A | $226,000 | -- | |
| Butler Floyd | $50,000 | -- |
Source: Public Records
Mortgage History
| Date | Status | Borrower | Loan Amount |
|---|---|---|---|
| Closed | Page Charles A | $145,000 | |
| Closed | Page Charles A | $155,000 | |
| Previous Owner | Butler Floyd | $90,400 |
Source: Public Records
Tax History
| Year | Tax Paid | Tax Assessment Tax Assessment Total Assessment is a certain percentage of the fair market value that is determined by local assessors to be the total taxable value of land and additions on the property. | Land | Improvement |
|---|---|---|---|---|
| 2025 | $6,636 | $76,000 | $24,400 | $51,600 |
| 2024 | $6,571 | $76,000 | $24,400 | $51,600 |
| 2023 | $6,571 | $76,000 | $24,400 | $51,600 |
| 2022 | $6,429 | $76,000 | $24,400 | $51,600 |
| 2021 | $6,373 | $76,000 | $24,400 | $51,600 |
| 2020 | $6,354 | $76,000 | $24,400 | $51,600 |
| 2019 | $6,354 | $76,000 | $24,400 | $51,600 |
| 2018 | $6,221 | $76,000 | $24,400 | $51,600 |
| 2017 | $6,069 | $76,000 | $24,400 | $51,600 |
| 2016 | $6,869 | $87,800 | $24,400 | $63,400 |
| 2015 | $6,666 | $87,800 | $24,400 | $63,400 |
| 2014 | $6,485 | $87,800 | $24,400 | $63,400 |
Source: Public Records
Map
Nearby Homes
- 19 H Washington Ave Unit H
- 560 W Front St
- 32 Washington Ave
- 64 Washington Ave
- 647 S 2nd St
- 700 W Front St Unit 2
- 401 Highway22b25u4ondo Unit 25D
- 720 W Front St
- 218 Muhlenberg Place Unit 20
- 34 Rockview Ave
- 409 John St Unit 11
- 126 Duer St
- 15 Linden Ave
- 542 W 6th St
- 16 Steiner Place
- 37 Harmony St
- 211 Grant Ave
- 46 Harmony St
- 301 Grant Ave Unit 3
- 745 W 4th St Unit 47
- 15 Sycamore Ave Unit 17
- 23 Sycamore Ave
- 25 Sycamore Ave Unit 27
- 29 Sycamore Ave Unit 31
- 22-24 Sycamore Ave
- 540 W Front St Unit 42
- 540 W Front St
- 530 W Front St Unit 34
- 536 W Front St Unit 38
- 33 Sycamore Ave Unit 35
- 18-20 Sycamore Ave
- 18 Sycamore Ave Unit 20
- 22 Sycamore Ave Unit 24
- 544 W Front St Unit 46
- 26 Sycamore Ave Unit 28
- 16 Sycamore Ave
- 30 Sycamore Ave Unit 32
- 12 Sycamore Ave Unit 14
- 542 W Front St
- 34 Sycamore Ave Unit 38
Your Personal Tour Guide
Ask me questions while you tour the home.