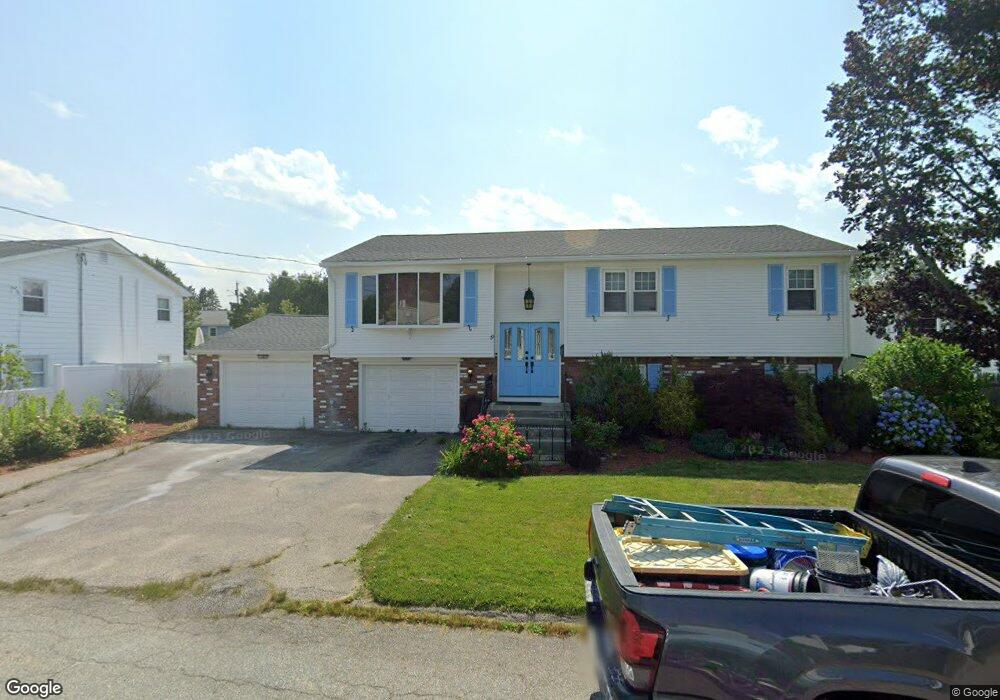
19 Talbot St North Providence, RI 02904
Marieville NeighborhoodEstimated Value: $457,000 - $600,000
3
Beds
2
Baths
1,394
Sq Ft
$365/Sq Ft
Est. Value
About This Home
This home is located at 19 Talbot St, North Providence, RI 02904 and is currently estimated at $509,107, approximately $365 per square foot. 19 Talbot St is a home located in Providence County with nearby schools including North Providence High School, The San Miguel School, and Bishop Keough Regional High School.
Ownership History
Date
Name
Owned For
Owner Type
Purchase Details
Closed on
Jun 21, 2004
Sold by
Silva Sylvia and Silva Robert P
Bought by
Chanmas Meelad Y and Chanmas Doba
Current Estimated Value
Home Financials for this Owner
Home Financials are based on the most recent Mortgage that was taken out on this home.
Original Mortgage
$183,900
Interest Rate
6.12%
Mortgage Type
Purchase Money Mortgage
Purchase Details
Closed on
May 5, 1998
Sold by
Rekos John J and Rekos Diane
Bought by
Silva Robert and Silva Sylvia
Create a Home Valuation Report for This Property
The Home Valuation Report is an in-depth analysis detailing your home's value as well as a comparison with similar homes in the area
Home Values in the Area
Average Home Value in this Area
Purchase History
| Date | Buyer | Sale Price | Title Company |
|---|---|---|---|
| Chanmas Meelad Y | $329,000 | -- | |
| Silva Robert | $140,000 | -- | |
| Chanmas Meelad Y | $329,000 | -- | |
| Silva Robert | $140,000 | -- |
Source: Public Records
Mortgage History
| Date | Status | Borrower | Loan Amount |
|---|---|---|---|
| Open | Chammas Meelad Y | $60,000 | |
| Closed | Silva Robert | $40,000 | |
| Open | Silva Robert | $182,000 | |
| Closed | Silva Robert | $183,900 |
Source: Public Records
Tax History Compared to Growth
Tax History
| Year | Tax Paid | Tax Assessment Tax Assessment Total Assessment is a certain percentage of the fair market value that is determined by local assessors to be the total taxable value of land and additions on the property. | Land | Improvement |
|---|---|---|---|---|
| 2024 | $5,910 | $355,800 | $78,100 | $277,700 |
| 2023 | $5,910 | $355,800 | $78,100 | $277,700 |
| 2022 | $6,065 | $265,900 | $68,200 | $197,700 |
| 2021 | $6,065 | $265,900 | $68,200 | $197,700 |
| 2020 | $6,065 | $265,900 | $68,200 | $197,700 |
| 2017 | $5,918 | $226,400 | $51,600 | $174,800 |
| 2016 | $5,638 | $201,800 | $55,900 | $145,900 |
| 2015 | $5,638 | $201,800 | $55,900 | $145,900 |
| 2014 | $5,638 | $201,800 | $55,900 | $145,900 |
Source: Public Records
Map
Nearby Homes
- 1190 Charles St Unit 21
- 1190 Charles St Unit 20
- 15 Bassett St
- 27 Gillen Ave Unit 205A
- 58 Needle Grove Point Unit D
- 5 Morrill Ln Unit C
- 9 Morrill Ln Unit 1
- 1375 Louisquissett Pike
- 64 Nipmuc Trail Unit A
- 62 Nipmuc Trail Unit D
- 68 Hilltop Dr Unit D
- 88 Nipmuc Trail Unit B
- 509 Woodward Rd
- 75 Valley Green Ct Unit C
- 58 Arthur Ave
- 72 Hilltop Dr Unit F
- 78 Valley Green Ct Unit A
- 76 Baird Ave
- 167 Alexander St
- 371 Woodward Rd