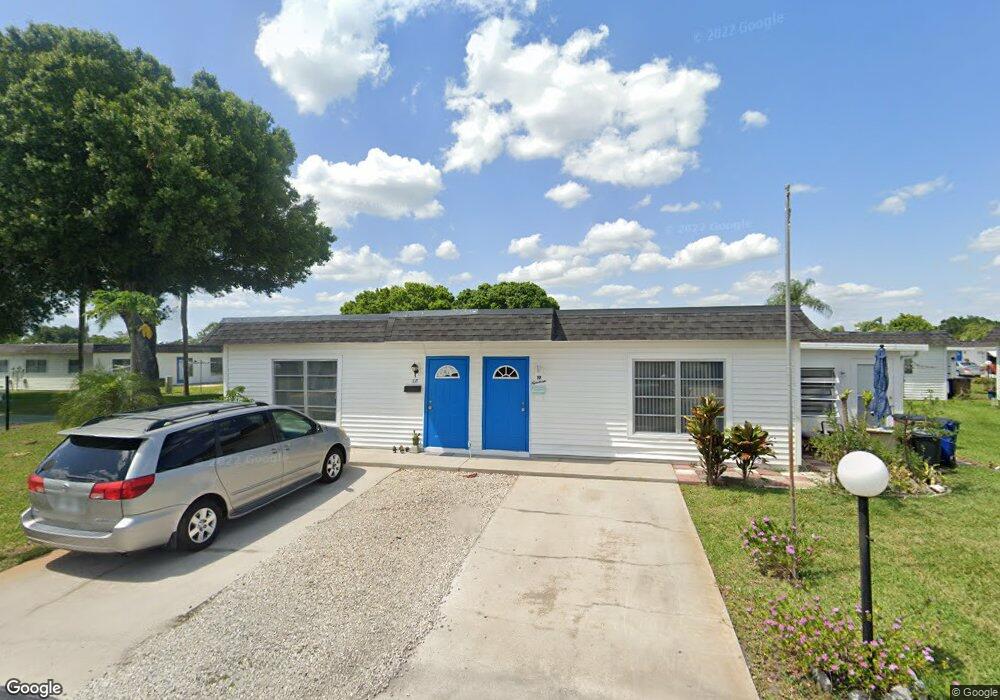
19 Tangerine Ct Unit 10 Lehigh Acres, FL 33936
Alabama NeighborhoodEstimated Value: $101,000 - $131,000
2
Beds
2
Baths
1,624
Sq Ft
$70/Sq Ft
Est. Value
About This Home
This home is located at 19 Tangerine Ct Unit 10, Lehigh Acres, FL 33936 and is currently estimated at $113,045, approximately $69 per square foot. 19 Tangerine Ct Unit 10 is a home located in Lee County with nearby schools including Lehigh Elementary School, Gateway Elementary School, and The Alva School.
Ownership History
Date
Name
Owned For
Owner Type
Purchase Details
Closed on
Jul 31, 2013
Sold by
Bostic James P and Bostic Mary Ann
Bought by
Delima Pedro Hamilton
Current Estimated Value
Purchase Details
Closed on
Apr 30, 2003
Sold by
Mims Micah
Bought by
Bostic James P and Bostic Mary Ann
Purchase Details
Closed on
Jul 28, 1999
Sold by
Housing & Urban Dev
Bought by
Mims Micah and Gilmore Marie
Purchase Details
Closed on
Nov 14, 1997
Sold by
Rice Gladys Mary
Bought by
Evans Robert A and Evans Mary A
Home Financials for this Owner
Home Financials are based on the most recent Mortgage that was taken out on this home.
Original Mortgage
$35,450
Interest Rate
7.31%
Mortgage Type
FHA
Purchase Details
Closed on
Oct 26, 1995
Sold by
Klein June Natalie
Bought by
Rice Gladys Marie
Home Financials for this Owner
Home Financials are based on the most recent Mortgage that was taken out on this home.
Original Mortgage
$26,600
Interest Rate
7.58%
Create a Home Valuation Report for This Property
The Home Valuation Report is an in-depth analysis detailing your home's value as well as a comparison with similar homes in the area
Home Values in the Area
Average Home Value in this Area
Purchase History
| Date | Buyer | Sale Price | Title Company |
|---|---|---|---|
| Delima Pedro Hamilton | $37,000 | Florida Title One Llc | |
| Bostic James P | $35,000 | -- | |
| Mims Micah | $27,000 | -- | |
| Evans Robert A | $35,900 | -- | |
| Rice Gladys Marie | $28,000 | -- |
Source: Public Records
Mortgage History
| Date | Status | Borrower | Loan Amount |
|---|---|---|---|
| Previous Owner | Evans Robert A | $35,450 | |
| Previous Owner | Rice Gladys Marie | $26,600 |
Source: Public Records
Tax History Compared to Growth
Tax History
| Year | Tax Paid | Tax Assessment Tax Assessment Total Assessment is a certain percentage of the fair market value that is determined by local assessors to be the total taxable value of land and additions on the property. | Land | Improvement |
|---|---|---|---|---|
| 2025 | $1,629 | $73,326 | -- | -- |
| 2024 | $1,451 | $66,660 | -- | -- |
| 2023 | $1,451 | $60,600 | $0 | $0 |
| 2022 | $1,259 | $55,091 | $0 | $0 |
| 2021 | $1,118 | $53,278 | $0 | $53,278 |
| 2020 | $1,091 | $52,488 | $0 | $52,488 |
| 2019 | $1,167 | $48,450 | $0 | $48,450 |
| 2018 | $1,073 | $39,568 | $0 | $39,568 |
| 2017 | $1,009 | $37,953 | $0 | $37,953 |
| 2016 | $953 | $34,617 | $0 | $34,617 |
| 2015 | $895 | $30,000 | $0 | $30,000 |
| 2014 | $620 | $25,700 | $0 | $25,700 |
| 2013 | -- | $23,800 | $0 | $23,800 |
Source: Public Records
Map
Nearby Homes
- 28 Temple Ct
- 44 Hamlin Ct
- 18 Hamlin Ct
- 45 Tangerine Ct
- 26 Temple Ct
- 14 Temple Ct
- 63 Tangelo Ct
- 42 Temple Ct
- 10554 Quincy Ct
- 10670 Talmadge Ct Unit 112
- 9 Palm Blvd
- 10635 Windsmont Ct
- 1105 Gifford Ave N
- 10655 Vanceboro Ct
- 1110 Rushmore Ave N
- 4 Palm Blvd
- 10615 Roxbury Ct Unit 26
- 410 Alabama Rd S
- 10444 Lakeport Ct
- 467 Valley Dr
- 41 Hamlin Ct
- 14 Tangerine Ct
- 43 Hamlin Ct
- 5 Tangerine Ct Unit 9H
- 56 Tangerine Ct Unit 9
- 11 Hamlin Ct Unit 3J
- 6 Tangelo Ct
- 35 Tangelo Ct
- 21 Hamlin Ct
- 39 Tangerine Ct
- 59 Tangerine Ct
- 48 Hamlin Ct
- 49 Hamlin Ct
- 46 Tangelo Ct
- 31 Temple Ct
- 9 Temple Ct
- 12 Tangerine Ct Unit 1G
- 2 Tangerine Ct
- 34 Hamlin Ct
- 17 Temple Ct Unit 8