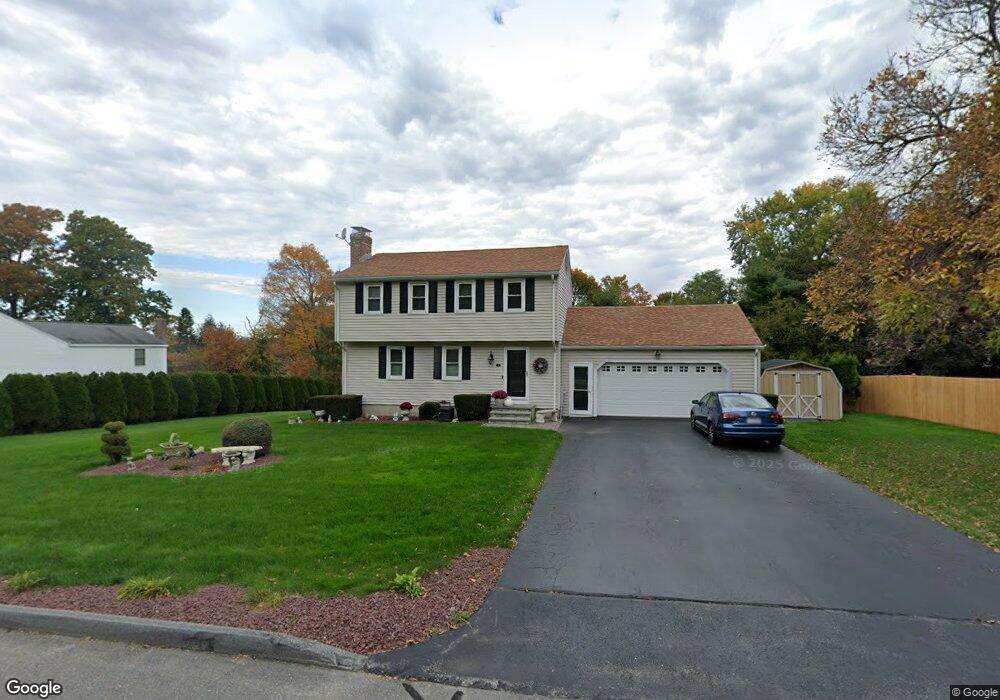
19 Tassi Dr Marlborough, MA 01752
French Hill NeighborhoodEstimated Value: $592,000 - $724,000
3
Beds
2
Baths
1,500
Sq Ft
$428/Sq Ft
Est. Value
About This Home
This home is located at 19 Tassi Dr, Marlborough, MA 01752 and is currently estimated at $642,311, approximately $428 per square foot. 19 Tassi Dr is a home located in Middlesex County with nearby schools including Marlborough High School, New Covenant Christian School, and Glenhaven Academy - JRI School.
Ownership History
Date
Name
Owned For
Owner Type
Purchase Details
Closed on
Jul 17, 2025
Sold by
Denise E Murphy Ret and Murphy
Bought by
Murphy Ft Of 2025 and Murphy
Current Estimated Value
Purchase Details
Closed on
May 19, 2010
Sold by
Murphy Denise E
Bought by
Denise E Murphy Ret and Murphy
Home Financials for this Owner
Home Financials are based on the most recent Mortgage that was taken out on this home.
Original Mortgage
$141,000
Interest Rate
5.23%
Mortgage Type
Purchase Money Mortgage
Purchase Details
Closed on
Jun 1, 1999
Sold by
Cowan Carmel S and Cowan Andrew W
Bought by
Murphy Denise E
Purchase Details
Closed on
Aug 4, 1988
Sold by
Noonan Patrick J
Bought by
Cowan Andrew W
Create a Home Valuation Report for This Property
The Home Valuation Report is an in-depth analysis detailing your home's value as well as a comparison with similar homes in the area
Home Values in the Area
Average Home Value in this Area
Purchase History
| Date | Buyer | Sale Price | Title Company |
|---|---|---|---|
| Murphy Ft Of 2025 | -- | -- | |
| Murphy Ft Of 2025 | -- | -- | |
| Denise E Murphy Ret | -- | -- | |
| Murphy Denise E | -- | -- | |
| Denise E Murphy Ret | -- | -- | |
| Denise E Murphy Ret | -- | -- | |
| Murphy Denise E | -- | -- | |
| Murphy Denise E | $203,000 | -- | |
| Cowan Andrew W | $190,000 | -- |
Source: Public Records
Mortgage History
| Date | Status | Borrower | Loan Amount |
|---|---|---|---|
| Previous Owner | Murphy Denise E | $141,000 |
Source: Public Records
Tax History Compared to Growth
Tax History
| Year | Tax Paid | Tax Assessment Tax Assessment Total Assessment is a certain percentage of the fair market value that is determined by local assessors to be the total taxable value of land and additions on the property. | Land | Improvement |
|---|---|---|---|---|
| 2025 | $5,820 | $590,300 | $261,200 | $329,100 |
| 2024 | $5,576 | $544,500 | $237,400 | $307,100 |
| 2023 | $5,973 | $517,600 | $193,800 | $323,800 |
| 2022 | $5,861 | $446,700 | $184,500 | $262,200 |
| 2021 | $5,680 | $411,600 | $156,600 | $255,000 |
| 2020 | $5,503 | $388,100 | $143,900 | $244,200 |
| 2019 | $5,316 | $377,800 | $140,900 | $236,900 |
| 2018 | $5,164 | $353,000 | $120,700 | $232,300 |
| 2017 | $4,745 | $309,700 | $117,900 | $191,800 |
| 2016 | $4,524 | $294,900 | $117,900 | $177,000 |
| 2015 | $4,673 | $296,500 | $127,500 | $169,000 |
Source: Public Records
Map
Nearby Homes
- 67 Hunter Ave
- 14 Calder St
- 53 Russell St
- 4 Quinn Rd
- 71 Hudson St
- 29 Elm St
- 582 Pleasant St
- 52 Norwood St
- 73 Howland St
- 287 Elm St
- 315 Bolton St
- 132 Prospect St
- 27 Jefferson St
- 27 Jefferson St Unit 204
- 36 Chestnut St
- 110 Prospect St
- 656 Bolton St
- 82 Brimsmead St
- 272 Lincoln St Unit 102
- 272 Lincoln St Unit 101