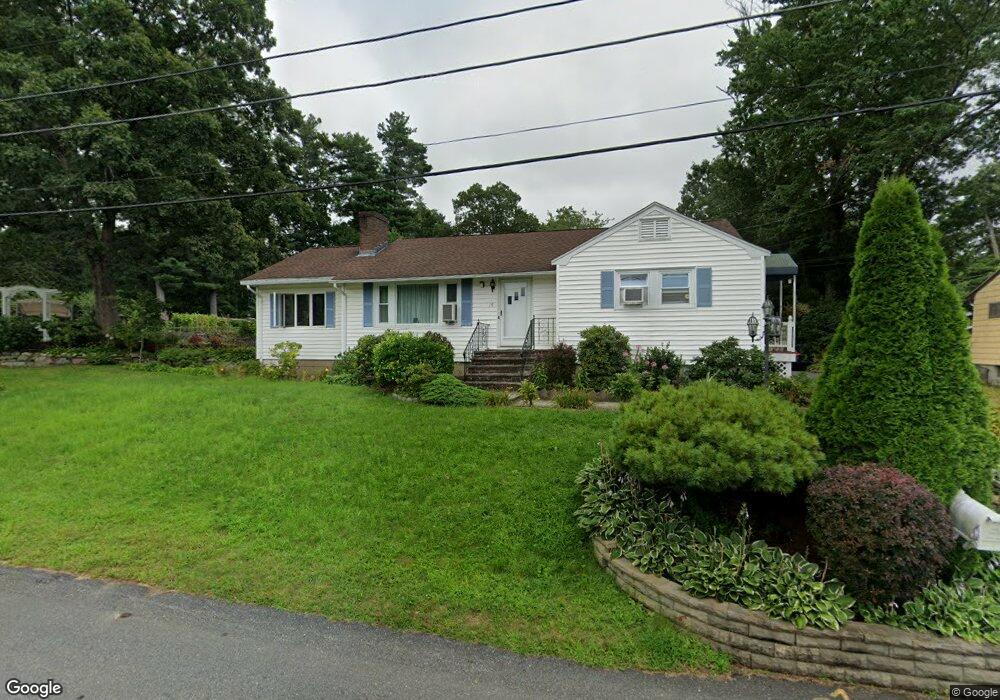
19 Thomas St Burlington, MA 01803
Burlington Town Center NeighborhoodEstimated Value: $700,786 - $824,000
3
Beds
1
Bath
1,446
Sq Ft
$528/Sq Ft
Est. Value
About This Home
This home is located at 19 Thomas St, Burlington, MA 01803 and is currently estimated at $763,947, approximately $528 per square foot. 19 Thomas St is a home located in Middlesex County with nearby schools including Burlington High School, Memorial Elementary School, and Marshall Simonds Middle School.
Ownership History
Date
Name
Owned For
Owner Type
Purchase Details
Closed on
Jan 23, 2020
Sold by
Huang Wei Y
Bought by
Huang Hai S
Current Estimated Value
Purchase Details
Closed on
Dec 8, 1999
Sold by
Fnma
Bought by
Huang Wei Ying and Huang May Ying
Home Financials for this Owner
Home Financials are based on the most recent Mortgage that was taken out on this home.
Original Mortgage
$158,000
Interest Rate
7.9%
Mortgage Type
Purchase Money Mortgage
Purchase Details
Closed on
Apr 30, 1999
Sold by
Raheman Fazal and Raheman Saihba
Bought by
Federal National Mortgage Association
Purchase Details
Closed on
Jun 16, 1994
Sold by
Mirabito Francis D and Mirabito Anthony F
Bought by
Raheman Fazal S and Raheman Saihba
Create a Home Valuation Report for This Property
The Home Valuation Report is an in-depth analysis detailing your home's value as well as a comparison with similar homes in the area
Home Values in the Area
Average Home Value in this Area
Purchase History
| Date | Buyer | Sale Price | Title Company |
|---|---|---|---|
| Huang Hai S | -- | None Available | |
| Huang Wei Ying | $228,000 | -- | |
| Federal National Mortgage Association | $172,431 | -- | |
| Raheman Fazal S | $181,500 | -- |
Source: Public Records
Mortgage History
| Date | Status | Borrower | Loan Amount |
|---|---|---|---|
| Previous Owner | Raheman Fazal S | $138,000 | |
| Previous Owner | Raheman Fazal S | $158,000 | |
| Previous Owner | Raheman Fazal S | $25,000 |
Source: Public Records
Tax History
| Year | Tax Paid | Tax Assessment Tax Assessment Total Assessment is a certain percentage of the fair market value that is determined by local assessors to be the total taxable value of land and additions on the property. | Land | Improvement |
|---|---|---|---|---|
| 2025 | $5,608 | $647,600 | $428,500 | $219,100 |
| 2024 | $5,271 | $589,600 | $391,200 | $198,400 |
| 2023 | $5,020 | $534,000 | $339,100 | $194,900 |
| 2022 | $4,925 | $495,000 | $308,300 | $186,700 |
| 2021 | $4,731 | $475,500 | $288,800 | $186,700 |
| 2020 | $4,549 | $471,900 | $284,100 | $187,800 |
| 2019 | $4,318 | $412,000 | $265,500 | $146,500 |
| 2018 | $4,231 | $398,400 | $258,000 | $140,400 |
| 2017 | $4,149 | $398,400 | $258,000 | $140,400 |
| 2016 | $4,111 | $358,700 | $223,600 | $135,100 |
| 2015 | $4,071 | $358,700 | $223,600 | $135,100 |
| 2014 | $3,989 | $332,400 | $199,300 | $133,100 |
Source: Public Records
Map
Nearby Homes
Your Personal Tour Guide
Ask me questions while you tour the home.