Estimated Value: $224,980 - $243,000
3
Beds
1
Bath
1,479
Sq Ft
$157/Sq Ft
Est. Value
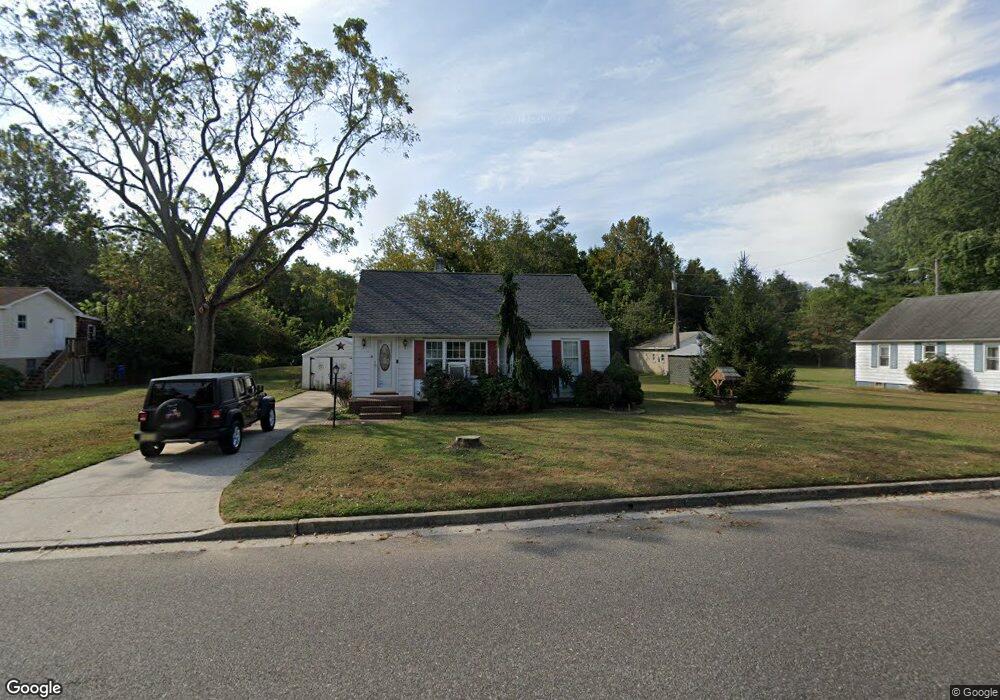
About This Home
This home is located at 19 Tilbury Rd, Salem, NJ 08079 and is currently estimated at $232,495, approximately $157 per square foot. 19 Tilbury Rd is a home located in Salem County with nearby schools including Elsinboro Township School.
Ownership History
Date
Name
Owned For
Owner Type
Purchase Details
Closed on
Apr 9, 2021
Sold by
Jennings Deborah and Carll Donna Lynn
Bought by
Alexander Tristan and White Shae
Current Estimated Value
Home Financials for this Owner
Home Financials are based on the most recent Mortgage that was taken out on this home.
Original Mortgage
$77,600
Outstanding Balance
$56,566
Interest Rate
2.9%
Mortgage Type
New Conventional
Estimated Equity
$175,929
Purchase Details
Closed on
Apr 30, 1981
Bought by
Carll Donald L
Create a Home Valuation Report for This Property
The Home Valuation Report is an in-depth analysis detailing your home's value as well as a comparison with similar homes in the area
Purchase History
| Date | Buyer | Sale Price | Title Company |
|---|---|---|---|
| Alexander Tristan | $80,000 | Salem Oak Title Agency Inc | |
| Carll Donald L | -- | -- |
Source: Public Records
Mortgage History
| Date | Status | Borrower | Loan Amount |
|---|---|---|---|
| Open | Alexander Tristan | $77,600 |
Source: Public Records
Tax History
| Year | Tax Paid | Tax Assessment Tax Assessment Total Assessment is a certain percentage of the fair market value that is determined by local assessors to be the total taxable value of land and additions on the property. | Land | Improvement |
|---|---|---|---|---|
| 2025 | $4,474 | $143,400 | $44,000 | $99,400 |
| 2024 | $4,474 | $143,400 | $44,000 | $99,400 |
| 2023 | $4,240 | $143,400 | $44,000 | $99,400 |
| 2022 | $4,134 | $143,400 | $44,000 | $99,400 |
| 2021 | $3,846 | $143,400 | $44,000 | $99,400 |
| 2020 | $3,797 | $143,400 | $44,000 | $99,400 |
| 2019 | $3,739 | $143,400 | $44,000 | $99,400 |
| 2018 | $3,646 | $143,400 | $44,000 | $99,400 |
| 2017 | $3,567 | $143,400 | $44,000 | $99,400 |
| 2016 | $3,428 | $143,400 | $44,000 | $99,400 |
| 2015 | $3,223 | $143,400 | $44,000 | $99,400 |
| 2014 | $3,110 | $143,400 | $44,000 | $99,400 |
Source: Public Records
Map
Nearby Homes
- 42 Tilbury Rd
- 68 S Tilbury Rd
- 40 Morning Side Dr
- 92 Sinnickson Landing Rd
- 10 Delaware Dr
- 249 Chestnut St
- 47 S 3rd St
- 0 Crossland Ave
- 69 Carpenter St
- 75 Hedge St Unit 2 RR
- 96 Thompson St
- 100-102 Thompson St
- 74 W Broadway
- 95 Hedge St
- 120 Thompson St
- 97 Chestnut St
- 160 Sinnickson Landing Rd
- 89 Chestnut St
- 79 Walnut St
- 67 Walnut St
Your Personal Tour Guide
Ask me questions while you tour the home.