19 Tinkers Ledge Rd Duxbury, MA 02332
Estimated Value: $953,000 - $1,310,000
4
Beds
3
Baths
2,640
Sq Ft
$440/Sq Ft
Est. Value
About This Home
This home is located at 19 Tinkers Ledge Rd, Duxbury, MA 02332 and is currently estimated at $1,162,554, approximately $440 per square foot. 19 Tinkers Ledge Rd is a home located in Plymouth County with nearby schools including Chandler Elementary School, Alden School, and Duxbury Middle School.
Ownership History
Date
Name
Owned For
Owner Type
Purchase Details
Closed on
Nov 1, 2024
Sold by
Dunne-Congdon Mary E
Bought by
Mary E Dunne-Congdon Ret and Dunne-Congdon
Current Estimated Value
Purchase Details
Closed on
Nov 23, 2022
Sold by
Congdon Mary E and Congdon John
Bought by
Dunne-Congdon Mary E
Purchase Details
Closed on
Nov 30, 2004
Sold by
Cendant Mobility Fincl
Bought by
Congdon John and Congdon Mary E
Purchase Details
Closed on
Jul 30, 1997
Sold by
Auda Greory S and Auda Theresa
Bought by
Mcconnaughey Kevin B and Mcconnaughey Laura C
Purchase Details
Closed on
Mar 31, 1994
Sold by
Schick David L
Bought by
Auda Gregory S and Auda Theresa
Create a Home Valuation Report for This Property
The Home Valuation Report is an in-depth analysis detailing your home's value as well as a comparison with similar homes in the area
Home Values in the Area
Average Home Value in this Area
Purchase History
| Date | Buyer | Sale Price | Title Company |
|---|---|---|---|
| Mary E Dunne-Congdon Ret | -- | None Available | |
| Mary E Dunne-Congdon Ret | -- | None Available | |
| Dunne-Congdon Mary E | -- | None Available | |
| Dunne-Congdon Mary E | -- | None Available | |
| Congdon John | $650,000 | -- | |
| Cendant Mobility Fincl | $650,000 | -- | |
| Mcconnaughey Kevin B | $360,000 | -- | |
| Cendant Mobility Fincl | $650,000 | -- | |
| Mcconnaughey Kevin B | $360,000 | -- | |
| Auda Gregory S | $342,000 | -- |
Source: Public Records
Mortgage History
| Date | Status | Borrower | Loan Amount |
|---|---|---|---|
| Previous Owner | Auda Gregory S | $135,500 | |
| Previous Owner | Auda Gregory S | $185,000 |
Source: Public Records
Tax History Compared to Growth
Tax History
| Year | Tax Paid | Tax Assessment Tax Assessment Total Assessment is a certain percentage of the fair market value that is determined by local assessors to be the total taxable value of land and additions on the property. | Land | Improvement |
|---|---|---|---|---|
| 2025 | $10,736 | $1,058,800 | $516,900 | $541,900 |
| 2024 | $10,216 | $1,015,500 | $477,400 | $538,100 |
| 2023 | $9,418 | $881,000 | $466,900 | $414,100 |
| 2022 | $9,972 | $776,600 | $396,000 | $380,600 |
| 2021 | $10,059 | $694,700 | $355,800 | $338,900 |
| 2020 | $9,939 | $678,000 | $316,600 | $361,400 |
| 2019 | $10,026 | $683,000 | $312,900 | $370,100 |
| 2018 | $9,546 | $629,700 | $273,800 | $355,900 |
| 2017 | $9,346 | $602,600 | $263,200 | $339,400 |
| 2016 | $9,119 | $586,400 | $247,000 | $339,400 |
| 2015 | $9,148 | $586,400 | $247,000 | $339,400 |
Source: Public Records
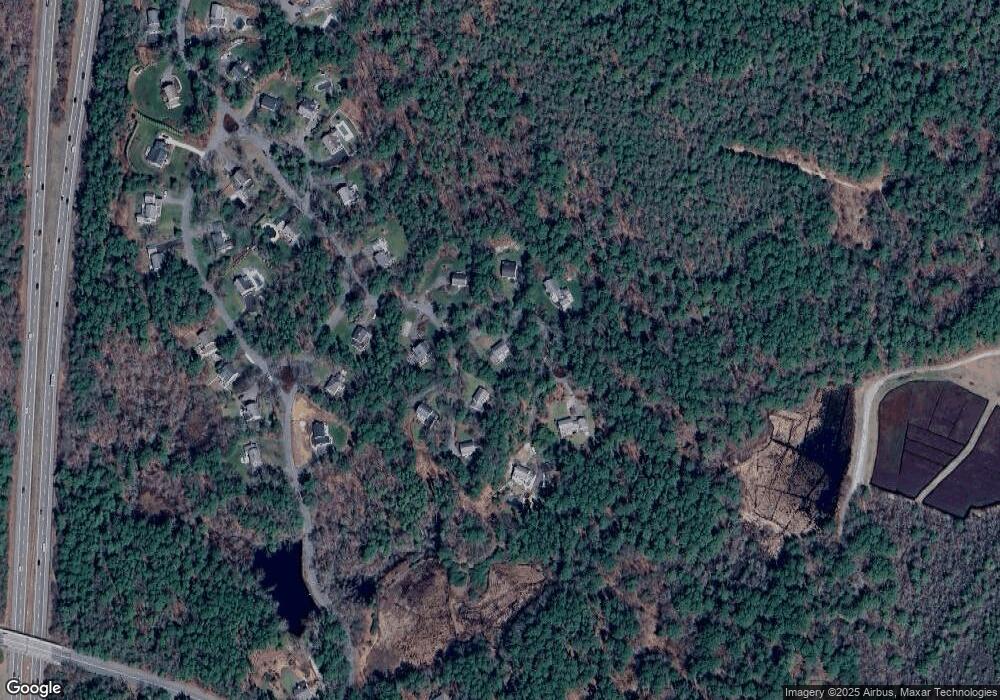
Map
Nearby Homes
- 20 Island Creek Rd
- 30 Cushing Dr
- 45 Summer St
- 131 East St
- 94 Buckboard Rd
- 19 Flint Locke Dr
- 0 East St
- 0 Kingstown Way
- 17 Trout Farm Ln
- 124 Evergreen St
- 37 Tarkiln Rd
- 117 Soule Ave
- 6 Kingstown Way
- 42 Trout Farm Ln Unit 2
- 64 Trout Farm Ln
- 197 Off Tarkiln Rd
- 53 Bay Farm Rd Unit 53
- 6 Priscilla Rd
- 59 Priscilla Ave
- 1 Tarkiln Rd
- 15 Tinkers Ledge Rd
- 3 Tinkers Ledge Rd
- 20 Tinkers Ledge Rd
- 16 Tinkers Ledge Rd
- 27 Tinkers Ledge Rd
- 11 Tinkers Ledge Rd
- 7 Tinkers Ledge Rd
- 21 Tinkers Ledge Rd
- 1 Tinkers Ledge Rd
- 55 Pine Lake Rd
- 35 Pine Lake Rd
- 25 Pine Lake Rd
- 65 Pine Lake Rd
- 66 Pine Lake Rd
- 40 Pine Lake Rd
- 21 Village Way
- 75 Pine Lake Rd
- 6 Village Way
- 30 Pine Lake Rd
- 23 Village Way