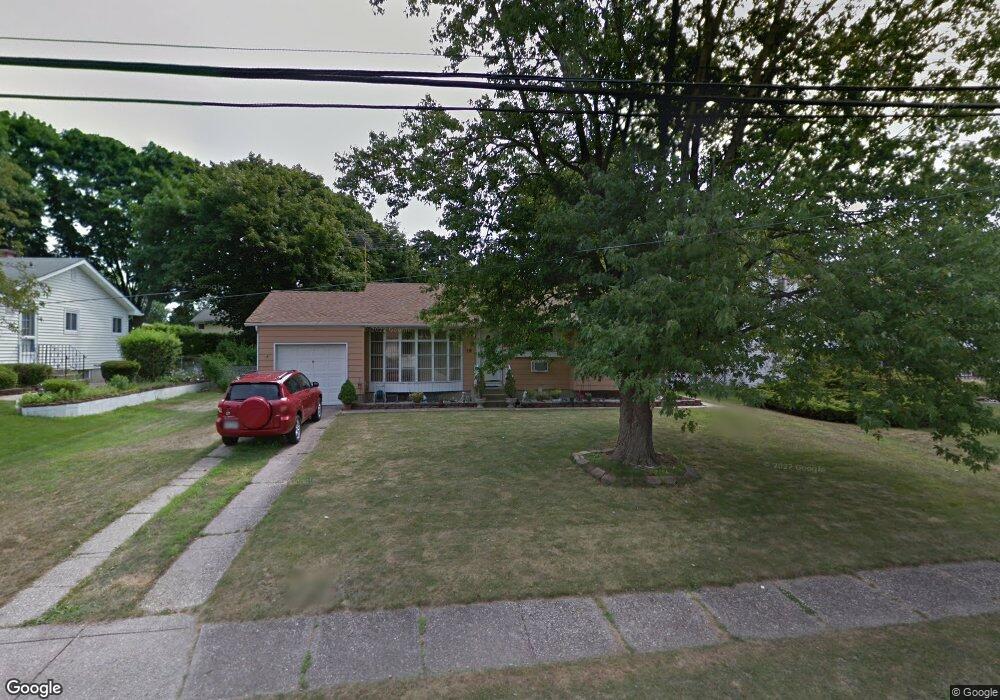
19 Trader Ln Brentwood, NY 11717
Estimated Value: $593,121 - $694,000
--
Bed
--
Bath
--
Sq Ft
0.25
Acres
About This Home
This home is located at 19 Trader Ln, Brentwood, NY 11717 and is currently estimated at $621,530. 19 Trader Ln is a home located in Suffolk County with nearby schools including MDQ Academy.
Ownership History
Date
Name
Owned For
Owner Type
Purchase Details
Closed on
Jun 20, 2003
Sold by
Paredes Luis E and Paredes Miguel
Bought by
Paredes Luis E
Current Estimated Value
Home Financials for this Owner
Home Financials are based on the most recent Mortgage that was taken out on this home.
Original Mortgage
$199,800
Outstanding Balance
$84,723
Interest Rate
5.34%
Mortgage Type
FHA
Estimated Equity
$536,807
Purchase Details
Closed on
Jan 2, 2002
Sold by
Petersen Henry J and Petersen Holly D
Bought by
Paredes Luis E and Paredes Miguel
Home Financials for this Owner
Home Financials are based on the most recent Mortgage that was taken out on this home.
Original Mortgage
$172,400
Interest Rate
7.15%
Mortgage Type
FHA
Create a Home Valuation Report for This Property
The Home Valuation Report is an in-depth analysis detailing your home's value as well as a comparison with similar homes in the area
Home Values in the Area
Average Home Value in this Area
Purchase History
| Date | Buyer | Sale Price | Title Company |
|---|---|---|---|
| Paredes Luis E | -- | -- | |
| Paredes Luis E | $174,900 | -- |
Source: Public Records
Mortgage History
| Date | Status | Borrower | Loan Amount |
|---|---|---|---|
| Open | Paredes Luis E | $199,800 | |
| Closed | Paredes Luis E | $172,400 |
Source: Public Records
Tax History Compared to Growth
Tax History
| Year | Tax Paid | Tax Assessment Tax Assessment Total Assessment is a certain percentage of the fair market value that is determined by local assessors to be the total taxable value of land and additions on the property. | Land | Improvement |
|---|---|---|---|---|
| 2024 | -- | $33,000 | $7,700 | $25,300 |
| 2023 | -- | $33,000 | $7,700 | $25,300 |
| 2022 | $7,249 | $33,000 | $7,700 | $25,300 |
| 2021 | $7,249 | $33,000 | $7,700 | $25,300 |
| 2020 | $6,718 | $33,000 | $7,700 | $25,300 |
| 2019 | $7,249 | $0 | $0 | $0 |
| 2018 | -- | $33,000 | $7,700 | $25,300 |
| 2017 | $7,364 | $33,000 | $7,700 | $25,300 |
| 2016 | $7,277 | $33,000 | $7,700 | $25,300 |
| 2015 | -- | $33,000 | $7,700 | $25,300 |
| 2014 | -- | $33,000 | $7,700 | $25,300 |
Source: Public Records
Map
Nearby Homes