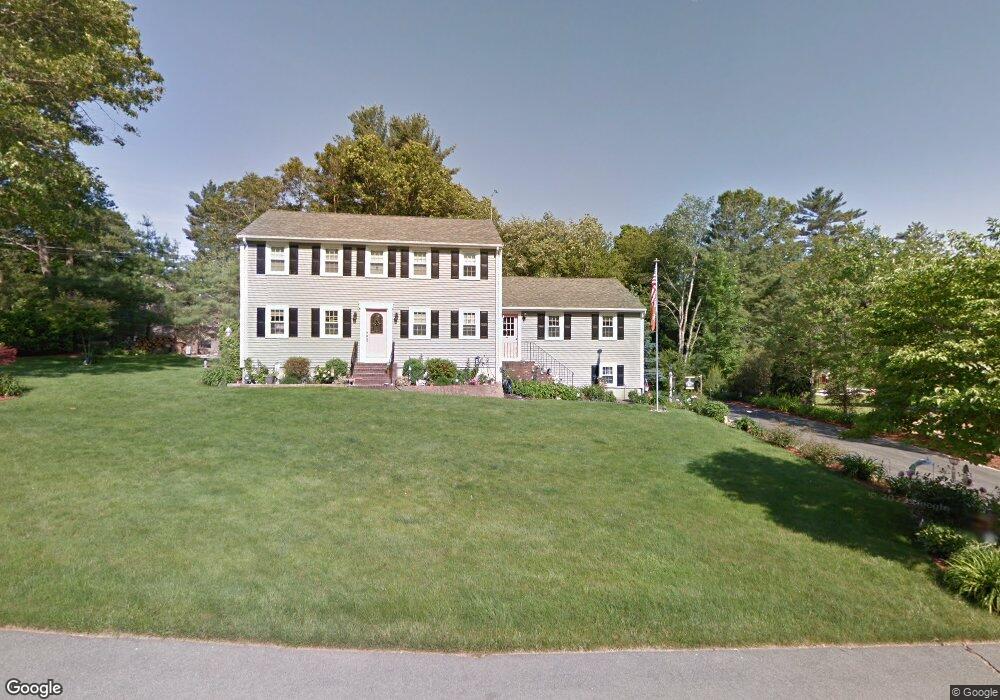
19 Trudeau Ln East Bridgewater, MA 02333
Estimated Value: $652,000 - $779,000
4
Beds
3
Baths
2,448
Sq Ft
$299/Sq Ft
Est. Value
About This Home
This home is located at 19 Trudeau Ln, East Bridgewater, MA 02333 and is currently estimated at $730,948, approximately $298 per square foot. 19 Trudeau Ln is a home located in Plymouth County with nearby schools including Central Elementary School, Gordon W Mitchell Middle School, and East Bridgewater Jr./Sr. High School.
Ownership History
Date
Name
Owned For
Owner Type
Purchase Details
Closed on
Oct 18, 1991
Sold by
Cmg Enterprises Ltd
Bought by
Gendron Paul R and Gendron Diane L
Current Estimated Value
Home Financials for this Owner
Home Financials are based on the most recent Mortgage that was taken out on this home.
Original Mortgage
$132,000
Interest Rate
9.06%
Mortgage Type
Purchase Money Mortgage
Create a Home Valuation Report for This Property
The Home Valuation Report is an in-depth analysis detailing your home's value as well as a comparison with similar homes in the area
Home Values in the Area
Average Home Value in this Area
Purchase History
| Date | Buyer | Sale Price | Title Company |
|---|---|---|---|
| Gendron Paul R | $165,000 | -- |
Source: Public Records
Mortgage History
| Date | Status | Borrower | Loan Amount |
|---|---|---|---|
| Open | Gendron Paul R | $100,000 | |
| Closed | Gendron Paul R | $25,000 | |
| Closed | Gendron Paul R | $133,000 | |
| Closed | Gendron Paul R | $132,000 |
Source: Public Records
Tax History Compared to Growth
Tax History
| Year | Tax Paid | Tax Assessment Tax Assessment Total Assessment is a certain percentage of the fair market value that is determined by local assessors to be the total taxable value of land and additions on the property. | Land | Improvement |
|---|---|---|---|---|
| 2025 | $8,437 | $617,200 | $225,400 | $391,800 |
| 2024 | $8,171 | $590,400 | $216,800 | $373,600 |
| 2023 | $7,995 | $553,300 | $216,800 | $336,500 |
| 2022 | $7,437 | $476,700 | $180,700 | $296,000 |
| 2021 | $7,335 | $430,200 | $173,700 | $256,500 |
| 2020 | $7,153 | $413,700 | $167,000 | $246,700 |
| 2019 | $6,934 | $394,900 | $159,600 | $235,300 |
| 2018 | $6,816 | $379,500 | $159,600 | $219,900 |
| 2017 | $6,619 | $361,700 | $152,200 | $209,500 |
| 2016 | $6,420 | $353,500 | $152,200 | $201,300 |
| 2015 | $6,232 | $350,900 | $151,100 | $199,800 |
| 2014 | $5,934 | $341,600 | $148,000 | $193,600 |
Source: Public Records
Map
Nearby Homes