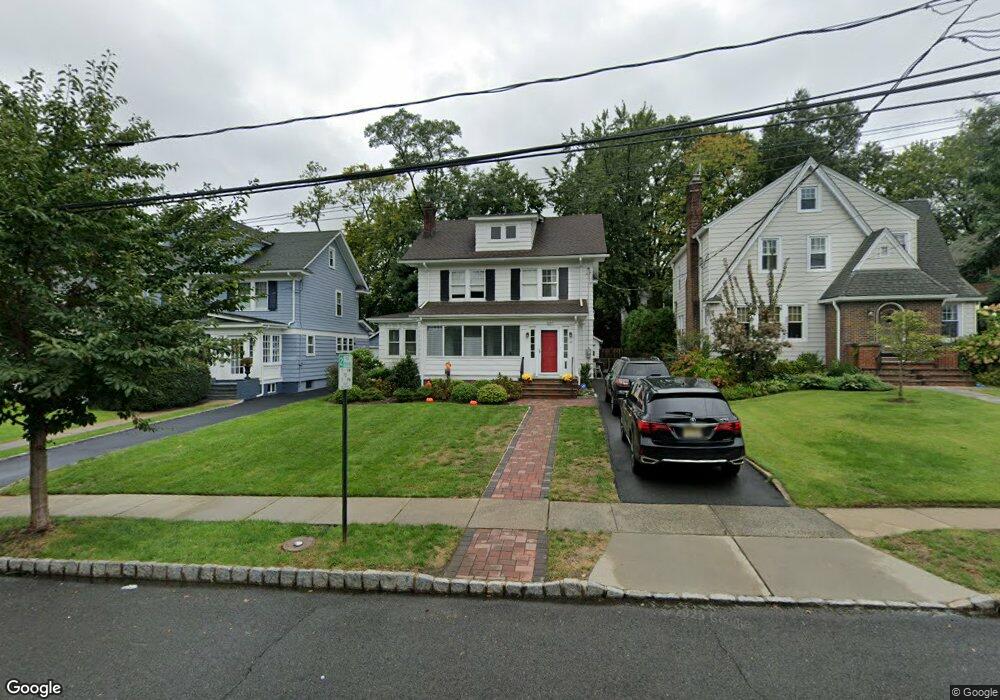
19 Undercliff Rd Millburn, NJ 07041
Estimated Value: $1,436,230 - $1,833,000
Studio
--
Bath
2,324
Sq Ft
$694/Sq Ft
Est. Value
About This Home
This home is located at 19 Undercliff Rd, Millburn, NJ 07041 and is currently estimated at $1,612,308, approximately $693 per square foot. 19 Undercliff Rd is a home located in Essex County with nearby schools including South Mountain School, Millburn Middle School, and Millburn High School.
Ownership History
Date
Name
Owned For
Owner Type
Purchase Details
Closed on
Jun 1, 2016
Sold by
Shrank David and Shrank Jeannie
Bought by
Sinoway Eric C and Sinoway Jennifer
Current Estimated Value
Home Financials for this Owner
Home Financials are based on the most recent Mortgage that was taken out on this home.
Original Mortgage
$710,000
Outstanding Balance
$565,817
Interest Rate
3.61%
Mortgage Type
New Conventional
Estimated Equity
$1,046,491
Purchase Details
Closed on
Jul 17, 2009
Sold by
Nelson Mark Louis and Nelson Miriam
Bought by
Shrank David and Shrank Jeannie
Home Financials for this Owner
Home Financials are based on the most recent Mortgage that was taken out on this home.
Original Mortgage
$600,000
Interest Rate
5.17%
Mortgage Type
New Conventional
Purchase Details
Closed on
Jan 24, 1993
Sold by
Tobin James E and Tobin Balutanski,Jean N
Bought by
Nelson Mark L and Nelson Tracy,Miriam
Create a Home Valuation Report for This Property
The Home Valuation Report is an in-depth analysis detailing your home's value as well as a comparison with similar homes in the area
Home Values in the Area
Average Home Value in this Area
Purchase History
We collect this data history from publicly available records. To have your information removed, we recommend requesting removal directly through your county’s website.
| Date | Buyer | Sale Price | Title Company |
|---|---|---|---|
| Sinoway Eric C | $887,500 | Max Title Agency Llc | |
| Shrank David | $782,500 | Stewart Title Guaranty Co | |
| Nelson Mark L | $262,500 | -- |
Source: Public Records
Mortgage History
We collect this data history from publicly available records. To have your information removed, we recommend requesting removal directly through your county’s website.
| Date | Status | Borrower | Loan Amount |
|---|---|---|---|
| Open | Sinoway Eric C | $710,000 | |
| Previous Owner | Shrank David | $600,000 |
Source: Public Records
Tax History
| Year | Tax Paid | Tax Assessment Tax Assessment Total Assessment is a certain percentage of the fair market value that is determined by local assessors to be the total taxable value of land and additions on the property. | Land | Improvement |
|---|---|---|---|---|
| 2025 | $16,974 | $856,400 | $518,600 | $337,800 |
| 2024 | $16,751 | $856,400 | $518,600 | $337,800 |
| 2022 | $16,640 | $856,400 | $518,600 | $337,800 |
| 2021 | $16,597 | $856,400 | $518,600 | $337,800 |
| 2020 | $16,494 | $856,400 | $518,600 | $337,800 |
| 2019 | $16,529 | $856,400 | $518,600 | $337,800 |
| 2018 | $16,289 | $856,400 | $518,600 | $337,800 |
| 2017 | $15,895 | $856,400 | $518,600 | $337,800 |
| 2016 | $14,764 | $685,400 | $337,400 | $348,000 |
| 2015 | $14,428 | $685,400 | $337,400 | $348,000 |
| 2014 | $13,818 | $685,400 | $337,400 | $348,000 |
Source: Public Records
Map
Nearby Homes
- 20 Parkview Dr
- 6 Cape Ct
- 909 Ridgewood Rd
- 30 Walnut Ave
- 161 Myrtle Ave
- 904 Ridgewood Rd
- 38 Farview Rd
- 84 Cedar St
- 118 Spring St
- 15 Evergreen Terrace
- 27 Willow St Unit A
- 27 Willow St
- 5 Brookside Dr
- 16 Old Short Hills Rd
- 23 Blaine St
- 426 Millburn Ave Unit A
- 39 Glen Ave
- 11 Hawthorne Rd
- 272 Glen Ave
- 50 Cypress St
- 21 Undercliff Rd
- 17 Undercliff Rd
- 23 Undercliff Rd
- 15 Undercliff Rd
- 13 Undercliff Rd
- 22 Parkview Dr
- 25 Undercliff Rd
- 18 Parkview Dr
- 24 Parkview Dr
- 16 Parkview Dr
- 11 Undercliff Rd
- 20 Undercliff Rd
- 27 Undercliff Rd
- 18 Undercliff Rd
- 22 Undercliff Rd
- 14 Parkview Dr
- 26 Parkview Dr
- 16 Undercliff Rd
- 24 Undercliff Rd
- 12 Parkview Dr
Your Personal Tour Guide
Ask me questions while you tour the home.