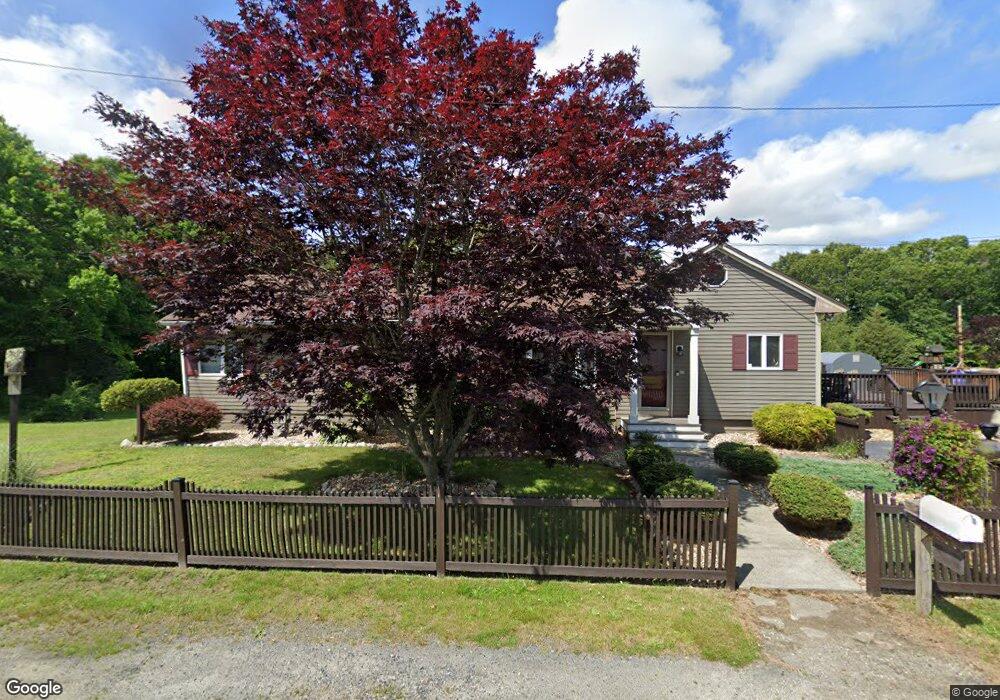
19 Union St Acushnet, MA 02743
North Fairhaven NeighborhoodEstimated Value: $341,000 - $412,482
--
Bed
1
Bath
1,253
Sq Ft
$303/Sq Ft
Est. Value
About This Home
This home is located at 19 Union St, Acushnet, MA 02743 and is currently estimated at $379,621, approximately $302 per square foot. 19 Union St is a home located in Bristol County with nearby schools including Acushnet Elementary School, Albert F Ford Middle School, and St Francis Xavier Elementary School.
Ownership History
Date
Name
Owned For
Owner Type
Purchase Details
Closed on
Jun 3, 2022
Sold by
Nadeau Kenneth T and Nadeau Stacy B
Bought by
Kenneth J Nadeau Lt and Nadeau
Current Estimated Value
Purchase Details
Closed on
Nov 18, 2009
Sold by
Nadeau Kenneth J and Nadeau Kenneth T
Bought by
Nadeau Kenneth J and Nadeau Stacey B
Home Financials for this Owner
Home Financials are based on the most recent Mortgage that was taken out on this home.
Original Mortgage
$132,400
Interest Rate
4.86%
Mortgage Type
Purchase Money Mortgage
Purchase Details
Closed on
May 16, 2001
Sold by
Hough Linda Mae
Bought by
Nadeau Kenneth T and Nadeau Stacey B
Home Financials for this Owner
Home Financials are based on the most recent Mortgage that was taken out on this home.
Original Mortgage
$140,600
Interest Rate
7.03%
Mortgage Type
Purchase Money Mortgage
Create a Home Valuation Report for This Property
The Home Valuation Report is an in-depth analysis detailing your home's value as well as a comparison with similar homes in the area
Home Values in the Area
Average Home Value in this Area
Purchase History
| Date | Buyer | Sale Price | Title Company |
|---|---|---|---|
| Kenneth J Nadeau Lt | -- | None Available | |
| Nadeau Kenneth J | -- | -- | |
| Nadeau Kenneth T | $148,000 | -- |
Source: Public Records
Mortgage History
| Date | Status | Borrower | Loan Amount |
|---|---|---|---|
| Previous Owner | Nadeau Kenneth T | $141,000 | |
| Previous Owner | Nadeau Kenneth T | $132,400 | |
| Previous Owner | Nadeau Kenneth T | $140,600 |
Source: Public Records
Tax History Compared to Growth
Tax History
| Year | Tax Paid | Tax Assessment Tax Assessment Total Assessment is a certain percentage of the fair market value that is determined by local assessors to be the total taxable value of land and additions on the property. | Land | Improvement |
|---|---|---|---|---|
| 2025 | $3,434 | $318,300 | $116,400 | $201,900 |
| 2024 | $3,294 | $288,700 | $111,000 | $177,700 |
| 2023 | $3,181 | $265,100 | $100,200 | $164,900 |
| 2022 | $3,197 | $240,900 | $94,800 | $146,100 |
| 2021 | $3,239 | $224,200 | $94,800 | $129,400 |
| 2020 | $3,125 | $224,200 | $94,800 | $129,400 |
| 2019 | $2,944 | $207,600 | $83,900 | $123,700 |
| 2018 | $2,864 | $198,600 | $83,900 | $114,700 |
| 2017 | $2,780 | $190,500 | $83,900 | $106,600 |
| 2016 | $2,717 | $187,000 | $83,900 | $103,100 |
| 2015 | $2,589 | $181,300 | $83,900 | $97,400 |
Source: Public Records
Map
Nearby Homes