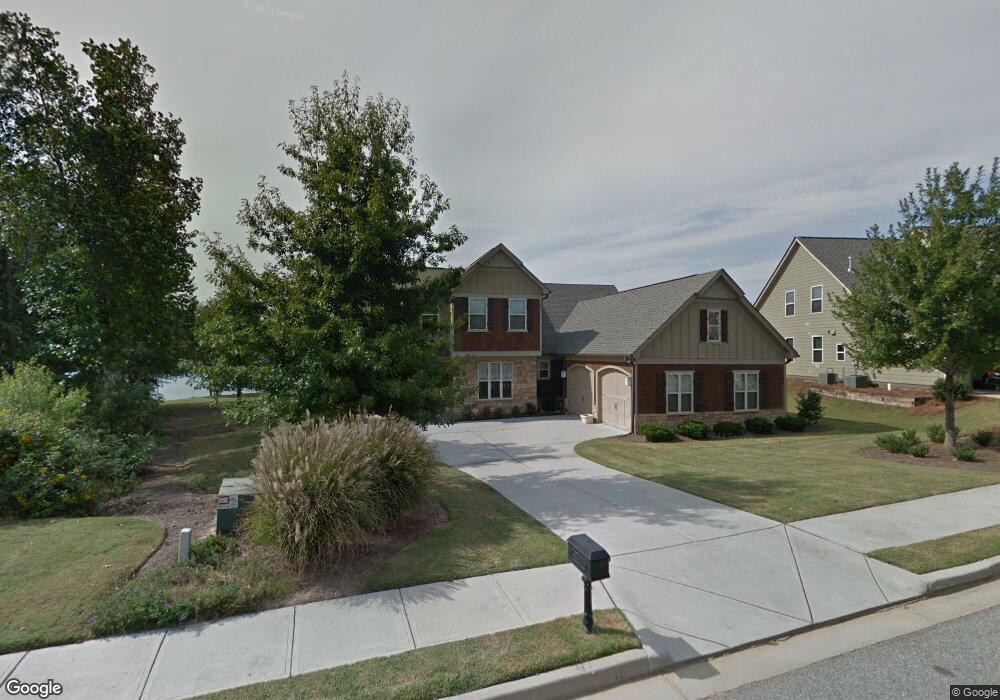
19 Vanderbilt Pointe Way Newnan, GA 30265
Estimated Value: $624,229 - $779,000
4
Beds
4
Baths
3,278
Sq Ft
$203/Sq Ft
Est. Value
About This Home
This home is located at 19 Vanderbilt Pointe Way, Newnan, GA 30265 and is currently estimated at $666,307, approximately $203 per square foot. 19 Vanderbilt Pointe Way is a home located in Coweta County with nearby schools including Welch Elementary School, Lee Middle School, and East Coweta High School.
Ownership History
Date
Name
Owned For
Owner Type
Purchase Details
Closed on
Jun 1, 2016
Sold by
Tansey John F
Bought by
Tansey John F and Tansey Chong Hwa
Current Estimated Value
Purchase Details
Closed on
Oct 1, 2007
Sold by
Jarman Mark D
Bought by
Jarman Marke D and Jarman Terry L
Home Financials for this Owner
Home Financials are based on the most recent Mortgage that was taken out on this home.
Original Mortgage
$218,400
Interest Rate
6.49%
Mortgage Type
New Conventional
Purchase Details
Closed on
Aug 17, 2006
Sold by
Olmsted Llc
Bought by
Shaw Homes Inc
Purchase Details
Closed on
Dec 6, 2002
Sold by
Roquemore William A
Bought by
Olmsted Llc
Purchase Details
Closed on
Jun 29, 1989
Bought by
Roquemore William A
Create a Home Valuation Report for This Property
The Home Valuation Report is an in-depth analysis detailing your home's value as well as a comparison with similar homes in the area
Home Values in the Area
Average Home Value in this Area
Purchase History
| Date | Buyer | Sale Price | Title Company |
|---|---|---|---|
| Tansey John F | -- | -- | |
| Jarman Marke D | -- | -- | |
| Jarman Mark D | $418,400 | -- | |
| Shaw Homes Inc | $248,000 | -- | |
| Olmsted Llc | -- | -- | |
| Roquemore William A | -- | -- |
Source: Public Records
Mortgage History
| Date | Status | Borrower | Loan Amount |
|---|---|---|---|
| Previous Owner | Jarman Mark D | $218,400 |
Source: Public Records
Tax History Compared to Growth
Tax History
| Year | Tax Paid | Tax Assessment Tax Assessment Total Assessment is a certain percentage of the fair market value that is determined by local assessors to be the total taxable value of land and additions on the property. | Land | Improvement |
|---|---|---|---|---|
| 2025 | $5,696 | $245,613 | $52,000 | $193,613 |
| 2024 | $5,245 | $232,922 | $52,000 | $180,922 |
| 2023 | $5,245 | $209,197 | $52,000 | $157,197 |
| 2022 | $4,834 | $202,175 | $52,000 | $150,175 |
| 2021 | $4,739 | $179,885 | $52,000 | $127,885 |
| 2020 | $4,844 | $179,885 | $52,000 | $127,885 |
| 2019 | $4,904 | $166,976 | $48,000 | $118,976 |
| 2018 | $4,933 | $166,976 | $48,000 | $118,976 |
| 2017 | $4,911 | $166,976 | $48,000 | $118,976 |
| 2016 | $4,673 | $158,925 | $48,000 | $110,925 |
| 2015 | $4,654 | $158,031 | $48,000 | $110,031 |
| 2014 | $4,983 | $158,031 | $48,000 | $110,031 |
Source: Public Records
Map
Nearby Homes
- 415 Vanderbilt Pkwy
- 10 Fenway Ct
- 147 Lake Cove Approach
- 460 Vanderbilt Pkwy
- 18 Berkeley Park
- 14 Avondale Cir
- 0 Mary Freeman Rd Unit 20069973
- 161 Lake Shore Dr
- 49 Leverett Dr
- 43 Beacon Crest
- 21 Terrace Park
- 306 Freeman Forest Dr
- 185 Lake Shore Dr
- 64 Gables Way
- 28 Fox Ridge Dr
- 15 Oak Shores Dr
- 37 Fox Ridge Dr
- 30 Oak Shores Dr
- 5 Corbel Way
- 53 Fox Ridge Dr
- 24 Vanderbilt Pointe Way
- 25 Vanderbilt Point Unit 18
- 23 Vanderbilt Pointe Way
- 25 Vanderbilt Pointe Ln Unit 18
- 25 Vanderbilt Pointe Ln
- 18 Vanderbilt Pointe Way
- 29 Vanderbilt Pointe Ln
- 14 Vanderbilt Pointe Way
- 21 Vanderbilt Pointe Ln
- 7 Vanderbilt Pointe Ln
- 33 Vanderbilt Pointe Ln
- 3 Vanderbilt Pointe Ln
- 3 Vanderbilt Pointe Ln Unit LOT 28
- 11 Vanderbilt Pointe Way Unit 22
- 11 Vanderbilt Pointe Way
- 27 Vanderbilt Pointe Way
- 7 Vanderbilt Pointe Way
- 37 Vanderbilt Pointe Ln Unit LOT 15
- 0 Vanderbilt Pointe Ln Unit LOT 18
- 0 Vanderbilt Pointe Ln Unit LOT 17 3038949