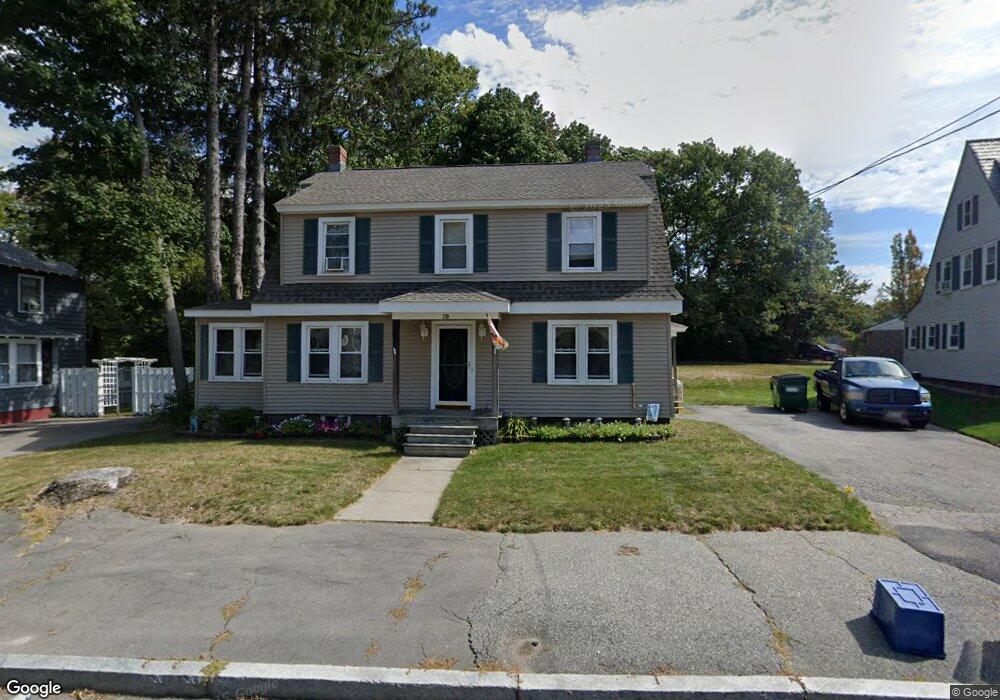
19 Varnum St Worcester, MA 01603
Webster Square NeighborhoodEstimated Value: $425,962 - $483,000
4
Beds
2
Baths
1,792
Sq Ft
$253/Sq Ft
Est. Value
About This Home
This home is located at 19 Varnum St, Worcester, MA 01603 and is currently estimated at $452,991, approximately $252 per square foot. 19 Varnum St is a home located in Worcester County with nearby schools including Gates Lane, Jacob Hiatt Magnet School, and Chandler Magnet.
Ownership History
Date
Name
Owned For
Owner Type
Purchase Details
Closed on
Sep 25, 1991
Sold by
Colex Rt
Bought by
Clark Russell J and Shelby Clark
Current Estimated Value
Purchase Details
Closed on
Jun 26, 1991
Sold by
M J Casa Dev Tr
Bought by
Colex Rt
Create a Home Valuation Report for This Property
The Home Valuation Report is an in-depth analysis detailing your home's value as well as a comparison with similar homes in the area
Home Values in the Area
Average Home Value in this Area
Purchase History
| Date | Buyer | Sale Price | Title Company |
|---|---|---|---|
| Clark Russell J | $88,500 | -- | |
| Colex Rt | $67,500 | -- |
Source: Public Records
Mortgage History
| Date | Status | Borrower | Loan Amount |
|---|---|---|---|
| Open | Colex Rt | $210,476 | |
| Closed | Colex Rt | $145,000 | |
| Closed | Colex Rt | $101,250 |
Source: Public Records
Tax History
| Year | Tax Paid | Tax Assessment Tax Assessment Total Assessment is a certain percentage of the fair market value that is determined by local assessors to be the total taxable value of land and additions on the property. | Land | Improvement |
|---|---|---|---|---|
| 2025 | $4,893 | $371,000 | $98,800 | $272,200 |
| 2024 | $4,786 | $348,100 | $98,800 | $249,300 |
| 2023 | $4,602 | $320,900 | $85,900 | $235,000 |
| 2022 | $4,248 | $279,300 | $68,700 | $210,600 |
| 2021 | $4,153 | $255,100 | $55,000 | $200,100 |
| 2020 | $4,010 | $235,900 | $54,600 | $181,300 |
| 2019 | $3,834 | $213,000 | $47,800 | $165,200 |
| 2018 | $3,807 | $201,300 | $47,800 | $153,500 |
| 2017 | $3,652 | $190,000 | $47,800 | $142,200 |
| 2016 | $3,642 | $176,700 | $34,800 | $141,900 |
| 2015 | $3,546 | $176,700 | $34,800 | $141,900 |
| 2014 | $3,453 | $176,700 | $34,800 | $141,900 |
Source: Public Records
Map
Nearby Homes
- 103 Henshaw St
- 84 Eureka St
- 10 Hulbert Rd Unit 10
- 55 Grandview Ave
- 27 Montague St
- 32 Goddard Memorial Dr
- 56 Goddard Memorial Dr
- 37 Gates Rd
- 13 Merchant St
- 89 Mill St
- 215 Mill St Unit 113
- 215 Mill St Unit 115
- 11 Timrod Dr
- 1038 Main St
- 18 Haynes St
- 1560 Main St
- 60 Circuit Ave S
- 10 Lucian St
- 12 Stoneland Rd
- 5 Stoneland Rd
Your Personal Tour Guide
Ask me questions while you tour the home.