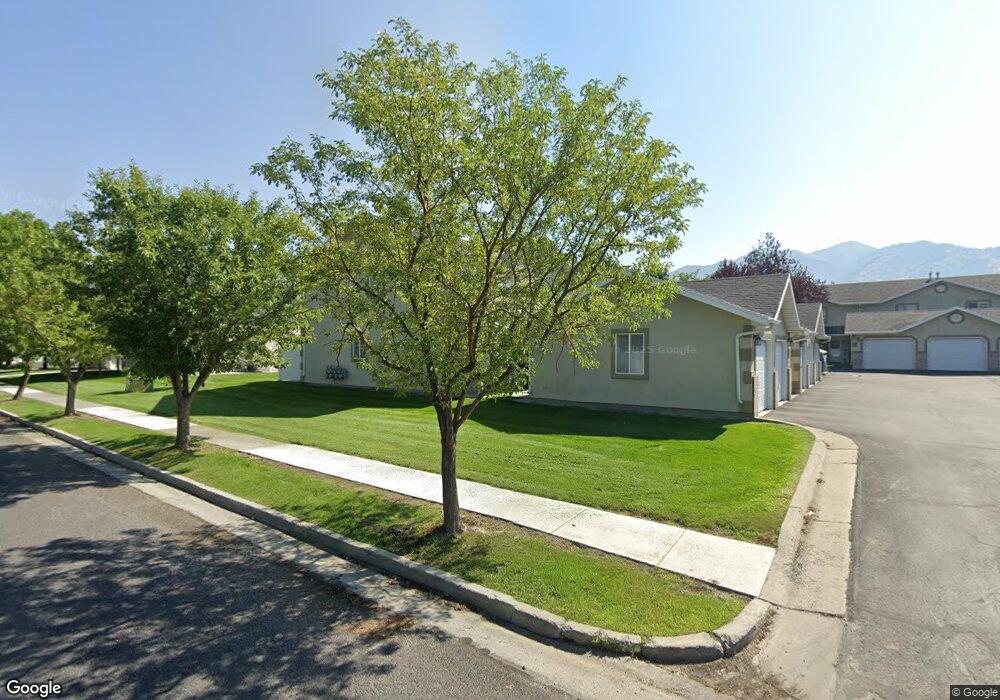
19 W 1325 S Logan, UT 84321
Woodruff NeighborhoodEstimated Value: $249,000 - $265,000
2
Beds
2
Baths
1,190
Sq Ft
$216/Sq Ft
Est. Value
About This Home
This home is located at 19 W 1325 S, Logan, UT 84321 and is currently estimated at $257,360, approximately $216 per square foot. 19 W 1325 S is a home located in Cache County with nearby schools including Hillcrest Elementary School, Mount Logan Middle School, and Logan High School.
Ownership History
Date
Name
Owned For
Owner Type
Purchase Details
Closed on
Oct 13, 2020
Sold by
Flores Maria
Bought by
Nettles Amanda
Current Estimated Value
Home Financials for this Owner
Home Financials are based on the most recent Mortgage that was taken out on this home.
Original Mortgage
$171,302
Outstanding Balance
$152,086
Interest Rate
2.8%
Mortgage Type
New Conventional
Estimated Equity
$105,274
Purchase Details
Closed on
Nov 30, 2017
Sold by
Tree Line Construction Llc
Bought by
Flores Maria
Home Financials for this Owner
Home Financials are based on the most recent Mortgage that was taken out on this home.
Original Mortgage
$124,699
Interest Rate
4.5%
Mortgage Type
FHA
Purchase Details
Closed on
Oct 4, 2011
Sold by
Small Laird John and Small Blithe
Bought by
Hansen Gary
Purchase Details
Closed on
Oct 3, 2011
Sold by
Hansen Gary
Bought by
Tree Line Construction Llc
Create a Home Valuation Report for This Property
The Home Valuation Report is an in-depth analysis detailing your home's value as well as a comparison with similar homes in the area
Home Values in the Area
Average Home Value in this Area
Purchase History
| Date | Buyer | Sale Price | Title Company |
|---|---|---|---|
| Nettles Amanda | -- | Advanced Title Insurance Age | |
| Flores Maria | -- | Aspen Title | |
| Hansen Gary | -- | American Secure Title Logan | |
| Tree Line Construction Llc | -- | Founders Title Co Syracuse |
Source: Public Records
Mortgage History
| Date | Status | Borrower | Loan Amount |
|---|---|---|---|
| Open | Nettles Amanda | $171,302 | |
| Previous Owner | Flores Maria | $124,699 |
Source: Public Records
Tax History Compared to Growth
Tax History
| Year | Tax Paid | Tax Assessment Tax Assessment Total Assessment is a certain percentage of the fair market value that is determined by local assessors to be the total taxable value of land and additions on the property. | Land | Improvement |
|---|---|---|---|---|
| 2025 | $1,085 | $140,375 | $0 | $0 |
| 2024 | $1,109 | $138,915 | $0 | $0 |
| 2023 | $1,233 | $147,180 | $0 | $0 |
| 2022 | $1,357 | $151,250 | $0 | $0 |
| 2021 | $1,155 | $198,890 | $50,000 | $148,890 |
| 2020 | $997 | $154,600 | $30,000 | $124,600 |
| 2019 | $925 | $137,272 | $30,000 | $107,272 |
| 2018 | $910 | $123,280 | $30,000 | $93,280 |
| 2017 | $805 | $57,640 | $0 | $0 |
| 2016 | $835 | $48,070 | $0 | $0 |
| 2015 | $692 | $47,745 | $0 | $0 |
| 2014 | $626 | $47,745 | $0 | $0 |
| 2013 | -- | $47,745 | $0 | $0 |
Source: Public Records
Map
Nearby Homes
- 130 W 1260 S
- 168 W 1275 S
- 593 W 300 S
- 475 W 60 S Unit L304
- 460 W 15 S Unit G202
- 470 W 15 S Unit F301
- 460 W 15 S Unit G201
- 460 W 15 S Unit G301
- 462 W 40 S Unit 202
- 268 W 1030 S
- 427 W 65 S
- 426 W 15 S
- 238 W 1010 S Unit 43
- 273 W 1010 S
- 265 W 1010 S
- 233 W 1010 S
- 866 Riverwood Dr
- 287 S 375 W
- 439 Meadow Ln
- 476 Cobblestone