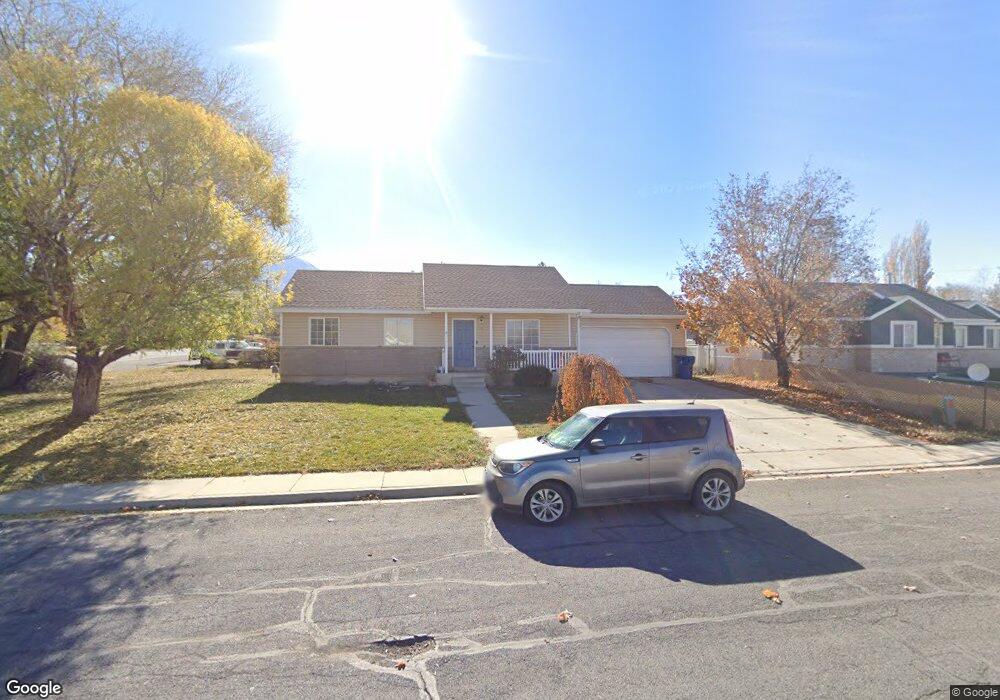
19 W 430 S Santaquin, UT 84655
Estimated Value: $446,000 - $529,000
5
Beds
3
Baths
2,268
Sq Ft
$211/Sq Ft
Est. Value
About This Home
This home is located at 19 W 430 S, Santaquin, UT 84655 and is currently estimated at $477,878, approximately $210 per square foot. 19 W 430 S is a home located in Utah County with nearby schools including Santaquin Elementary School, Payson Junior High School, and Payson High School.
Ownership History
Date
Name
Owned For
Owner Type
Purchase Details
Closed on
Feb 12, 2015
Sold by
Dorado Investments One Llc
Bought by
Waters Jacob and Waters Lisa
Current Estimated Value
Purchase Details
Closed on
Nov 10, 2014
Sold by
Morris Jacob and American Lending Network Inc
Bought by
Dorado Investments One Llc
Purchase Details
Closed on
Aug 23, 2013
Sold by
High Desert Real Estate Llc
Bought by
Thomson Michael F
Purchase Details
Closed on
Aug 24, 2007
Sold by
Morris Jacob
Bought by
High Desert Real Estate Llc
Home Financials for this Owner
Home Financials are based on the most recent Mortgage that was taken out on this home.
Original Mortgage
$140,250
Interest Rate
6.73%
Mortgage Type
Purchase Money Mortgage
Purchase Details
Closed on
May 5, 2006
Sold by
Ross Jay F and Ross Becky A
Bought by
Cox Richard L
Purchase Details
Closed on
Jul 5, 2001
Sold by
K & J Construction Inc
Bought by
Ross Jay F and Ross Becky A
Create a Home Valuation Report for This Property
The Home Valuation Report is an in-depth analysis detailing your home's value as well as a comparison with similar homes in the area
Home Values in the Area
Average Home Value in this Area
Purchase History
| Date | Buyer | Sale Price | Title Company |
|---|---|---|---|
| Waters Jacob | -- | Select Title Ins Agency | |
| Dorado Investments One Llc | $121,000 | None Available | |
| Thomson Michael F | -- | None Available | |
| High Desert Real Estate Llc | -- | Action Title Company | |
| Morris Jacob | -- | Action Title Company | |
| Cox Richard L | -- | Old Republic Title Company | |
| Ross Jay F | -- | First American Title Insuran |
Source: Public Records
Mortgage History
| Date | Status | Borrower | Loan Amount |
|---|---|---|---|
| Previous Owner | Morris Jacob | $140,250 |
Source: Public Records
Tax History Compared to Growth
Tax History
| Year | Tax Paid | Tax Assessment Tax Assessment Total Assessment is a certain percentage of the fair market value that is determined by local assessors to be the total taxable value of land and additions on the property. | Land | Improvement |
|---|---|---|---|---|
| 2025 | $2,224 | $251,130 | $130,100 | $326,500 |
| 2024 | $2,224 | $221,485 | $0 | $0 |
| 2023 | $2,281 | $227,920 | $0 | $0 |
| 2022 | $2,180 | $224,620 | $0 | $0 |
| 2021 | $1,876 | $299,700 | $73,400 | $226,300 |
| 2020 | $1,798 | $278,300 | $63,800 | $214,500 |
| 2019 | $1,694 | $268,100 | $60,200 | $207,900 |
| 2018 | $1,603 | $241,900 | $56,700 | $185,200 |
| 2017 | $1,485 | $119,735 | $0 | $0 |
| 2016 | $1,318 | $104,115 | $0 | $0 |
| 2015 | $1,256 | $97,350 | $0 | $0 |
| 2014 | $1,128 | $87,230 | $0 | $0 |
Source: Public Records
Map
Nearby Homes
- 50 W 400 S
- 260 S Center St
- 20 E 200 S
- 498 S 300 E
- 295 E 300 S
- 781 S Brubaker Way
- 822 S Horizon Loop Unit 513
- 700 S 300 W
- 49 S 100 E
- 163 E 850 S
- 1700 Farmhouse Plan at Tanner Flats
- 2400 Farmhouse Plan at Tanner Flats
- 866 S Brubaker Way
- 879 S Brubaker Way
- 341 E 100 S
- 343 E 100 St S
- 345 E 100 St S
- 153 E Main St Unit B
- 873 S 250 E
- 521 E 550 S