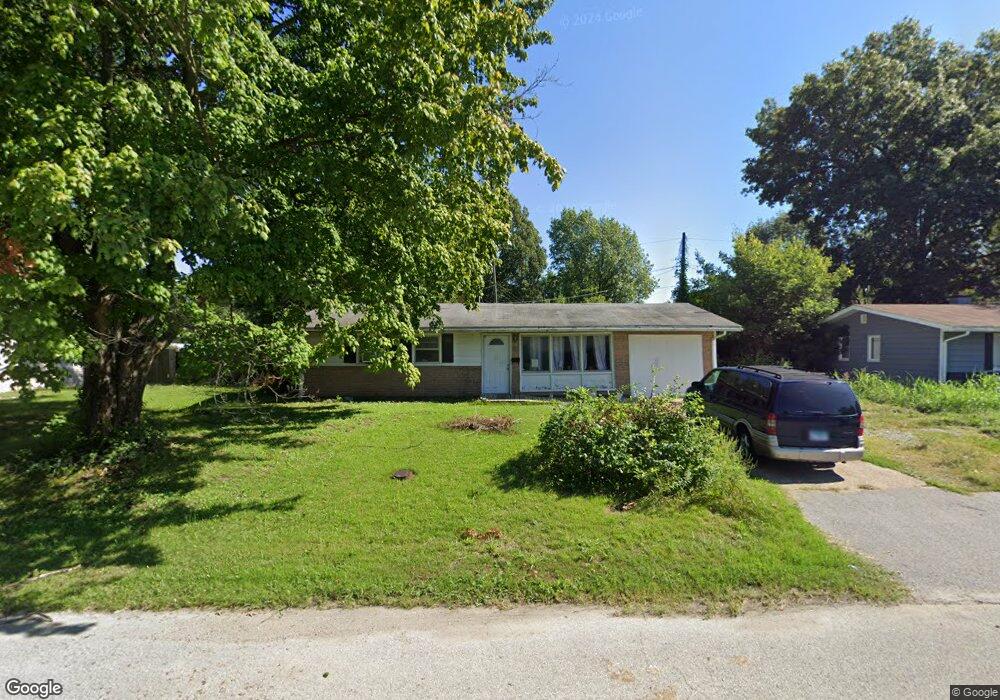
19 W Adams Dr East Saint Louis, IL 62206
Estimated Value: $74,598 - $94,000
--
Bed
--
Bath
1,225
Sq Ft
$71/Sq Ft
Est. Value
About This Home
This home is located at 19 W Adams Dr, East Saint Louis, IL 62206 and is currently estimated at $86,650, approximately $70 per square foot. 19 W Adams Dr is a home located in St. Clair County.
Ownership History
Date
Name
Owned For
Owner Type
Purchase Details
Closed on
Oct 9, 2024
Sold by
Pfp Llc
Bought by
Maldonado Kerwin G M
Current Estimated Value
Purchase Details
Closed on
Jul 11, 2007
Sold by
Illinois Property Development Llc
Bought by
Pfp Llc
Purchase Details
Closed on
Apr 27, 2007
Sold by
Vahey Joseph T and Vahey Sherry L
Bought by
Illinois Property Development Llc
Home Financials for this Owner
Home Financials are based on the most recent Mortgage that was taken out on this home.
Original Mortgage
$17,000
Interest Rate
6.21%
Mortgage Type
Purchase Money Mortgage
Create a Home Valuation Report for This Property
The Home Valuation Report is an in-depth analysis detailing your home's value as well as a comparison with similar homes in the area
Home Values in the Area
Average Home Value in this Area
Purchase History
| Date | Buyer | Sale Price | Title Company |
|---|---|---|---|
| Maldonado Kerwin G M | $22,000 | None Available | |
| Pfp Llc | $25,000 | Benedick Title Ins | |
| Illinois Property Development Llc | $14,500 | Benchmark Title Company |
Source: Public Records
Mortgage History
| Date | Status | Borrower | Loan Amount |
|---|---|---|---|
| Previous Owner | Illinois Property Development Llc | $17,000 |
Source: Public Records
Tax History Compared to Growth
Tax History
| Year | Tax Paid | Tax Assessment Tax Assessment Total Assessment is a certain percentage of the fair market value that is determined by local assessors to be the total taxable value of land and additions on the property. | Land | Improvement |
|---|---|---|---|---|
| 2024 | $1,301 | $6,799 | $1,309 | $5,490 |
| 2023 | $1,174 | $6,145 | $1,183 | $4,962 |
| 2022 | $1,071 | $5,386 | $1,037 | $4,349 |
| 2021 | $1,119 | $5,104 | $983 | $4,121 |
| 2020 | $1,439 | $6,061 | $1,030 | $5,031 |
| 2019 | $1,467 | $6,061 | $1,030 | $5,031 |
| 2018 | $1,459 | $6,149 | $1,045 | $5,104 |
| 2017 | $1,070 | $6,000 | $1,020 | $4,980 |
| 2016 | $756 | $2,945 | $1,016 | $1,929 |
| 2014 | $626 | $2,913 | $1,005 | $1,908 |
| 2013 | $2,259 | $2,733 | $943 | $1,790 |
Source: Public Records
Map
Nearby Homes