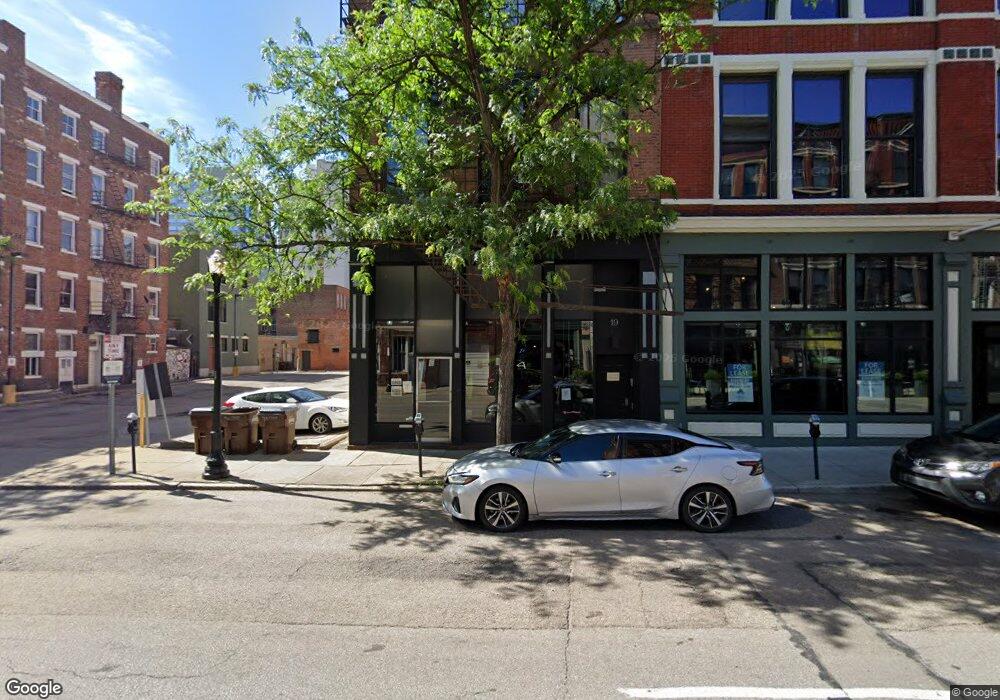
19 W Court St Cincinnati, OH 45202
City Center NeighborhoodEstimated Value: $443,000 - $505,000
1
Bed
1
Bath
1,704
Sq Ft
$277/Sq Ft
Est. Value
About This Home
This home is located at 19 W Court St, Cincinnati, OH 45202 and is currently estimated at $471,680, approximately $276 per square foot. 19 W Court St is a home located in Hamilton County with nearby schools including Rothenberg Preparatory Academy, Robert A. Taft Information Technology High School, and Gilbert A. Dater High School.
Ownership History
Date
Name
Owned For
Owner Type
Purchase Details
Closed on
Jul 13, 2021
Sold by
Dye Jennifer M and Dye Floyd D
Bought by
Brauer David Patrick and Brauer Jennifer L
Current Estimated Value
Home Financials for this Owner
Home Financials are based on the most recent Mortgage that was taken out on this home.
Original Mortgage
$389,500
Outstanding Balance
$353,411
Interest Rate
2.9%
Mortgage Type
New Conventional
Estimated Equity
$118,269
Purchase Details
Closed on
May 23, 2006
Sold by
Desmarais Charles J and Morgan Katherine A
Bought by
Dye Floyd D and Dye Jennifer M
Home Financials for this Owner
Home Financials are based on the most recent Mortgage that was taken out on this home.
Original Mortgage
$156,000
Interest Rate
6.72%
Mortgage Type
Unknown
Purchase Details
Closed on
Dec 20, 2001
Sold by
Dieringer Richard E
Bought by
Desmarais Charles J and Morgan Katherine A
Create a Home Valuation Report for This Property
The Home Valuation Report is an in-depth analysis detailing your home's value as well as a comparison with similar homes in the area
Home Values in the Area
Average Home Value in this Area
Purchase History
| Date | Buyer | Sale Price | Title Company |
|---|---|---|---|
| Brauer David Patrick | $410,000 | Lawyers Title | |
| Dye Floyd D | -- | The Main Title Agency | |
| Desmarais Charles J | -- | -- |
Source: Public Records
Mortgage History
| Date | Status | Borrower | Loan Amount |
|---|---|---|---|
| Open | Brauer David Patrick | $389,500 | |
| Previous Owner | Dye Floyd D | $156,000 |
Source: Public Records
Tax History Compared to Growth
Tax History
| Year | Tax Paid | Tax Assessment Tax Assessment Total Assessment is a certain percentage of the fair market value that is determined by local assessors to be the total taxable value of land and additions on the property. | Land | Improvement |
|---|---|---|---|---|
| 2024 | $8,787 | $143,500 | $18,375 | $125,125 |
| 2023 | $8,980 | $143,500 | $18,375 | $125,125 |
| 2022 | $5,286 | $74,536 | $18,375 | $56,161 |
| 2021 | $5,099 | $74,536 | $18,375 | $56,161 |
| 2020 | $5,180 | $74,536 | $18,375 | $56,161 |
| 2019 | $5,647 | $74,536 | $18,375 | $56,161 |
| 2018 | $5,642 | $74,536 | $18,375 | $56,161 |
| 2017 | $5,368 | $74,536 | $18,375 | $56,161 |
| 2016 | $4,745 | $64,838 | $18,375 | $46,463 |
| 2015 | $4,290 | $64,838 | $18,375 | $46,463 |
| 2014 | $4,315 | $64,838 | $18,375 | $46,463 |
| 2013 | $4,388 | $64,838 | $18,375 | $46,463 |
Source: Public Records
Map
Nearby Homes
- 19 W Court St Unit 1
- 19 W Court St
- 19 W Court St Unit 4
- 19 W Court St Unit 3
- 103 W Court St
- 23 W Court St
- 21 W Court St
- 28 W Court St
- 7 W Court St
- 16 W Court St
- 32 W Court St
- 22 W Court St
- 20 W Court St
- 12 E Court St
- 34 W Court St
- 36 W Court St
- 30 W Court St Unit 204
- 924 Race St
- 920 Race St
- 915 Vine St Unit 401