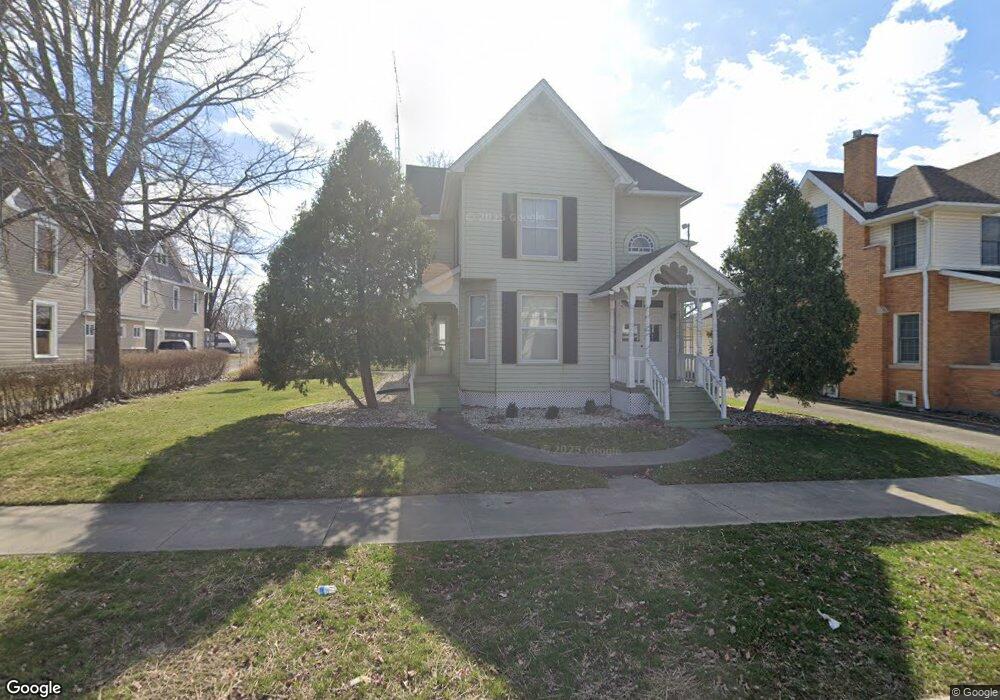
19 W Main St Leipsic, OH 45856
Estimated Value: $171,000 - $231,000
3
Beds
2
Baths
2,080
Sq Ft
$97/Sq Ft
Est. Value
About This Home
This home is located at 19 W Main St, Leipsic, OH 45856 and is currently estimated at $201,665, approximately $96 per square foot. 19 W Main St is a home located in Putnam County with nearby schools including Leipsic Elementary School, Leipsic High School, and St. Mary's Catholic School.
Ownership History
Date
Name
Owned For
Owner Type
Purchase Details
Closed on
Sep 8, 2021
Sold by
Mcdonald Tonja and Claybaugh Eric
Bought by
Lammers Heather and Pedroza Hiegel Devin
Current Estimated Value
Home Financials for this Owner
Home Financials are based on the most recent Mortgage that was taken out on this home.
Original Mortgage
$127,000
Outstanding Balance
$114,548
Interest Rate
2.8%
Mortgage Type
Future Advance Clause Open End Mortgage
Estimated Equity
$87,117
Purchase Details
Closed on
Nov 17, 2020
Sold by
Claybaugh Charles E
Bought by
Mcdonald Tonja and Claybaugh Eric
Create a Home Valuation Report for This Property
The Home Valuation Report is an in-depth analysis detailing your home's value as well as a comparison with similar homes in the area
Purchase History
We collect this data history from publicly available records. To have your information removed, we recommend requesting removal directly through your county’s website.
| Date | Buyer | Sale Price | Title Company |
|---|---|---|---|
| Lammers Heather | $80,000 | None Available | |
| Mcdonald Tonja | -- | None Available |
Source: Public Records
Mortgage History
We collect this data history from publicly available records. To have your information removed, we recommend requesting removal directly through your county’s website.
| Date | Status | Borrower | Loan Amount |
|---|---|---|---|
| Open | Lammers Heather | $127,000 |
Source: Public Records
Tax History
| Year | Tax Paid | Tax Assessment Tax Assessment Total Assessment is a certain percentage of the fair market value that is determined by local assessors to be the total taxable value of land and additions on the property. | Land | Improvement |
|---|---|---|---|---|
| 2025 | $1,924 | $63,350 | $4,360 | $58,990 |
| 2024 | $1,980 | $63,350 | $4,360 | $58,990 |
| 2023 | $2,082 | $50,110 | $3,400 | $46,710 |
| 2022 | $2,018 | $50,110 | $3,399 | $46,711 |
| 2021 | $2,028 | $50,110 | $3,399 | $46,711 |
| 2020 | $1,669 | $39,960 | $3,030 | $36,930 |
| 2019 | $1,264 | $41,210 | $3,400 | $37,810 |
| 2018 | $1,241 | $41,210 | $3,400 | $37,810 |
| 2017 | $1,106 | $41,210 | $3,400 | $37,810 |
| 2016 | $1,106 | $39,960 | $3,030 | $36,930 |
| 2015 | $1,088 | $39,960 | $3,030 | $36,930 |
| 2014 | $1,060 | $39,960 | $3,030 | $36,930 |
| 2013 | $1,094 | $39,960 | $3,030 | $36,930 |
Source: Public Records
Map
Nearby Homes
Your Personal Tour Guide
Ask me questions while you tour the home.