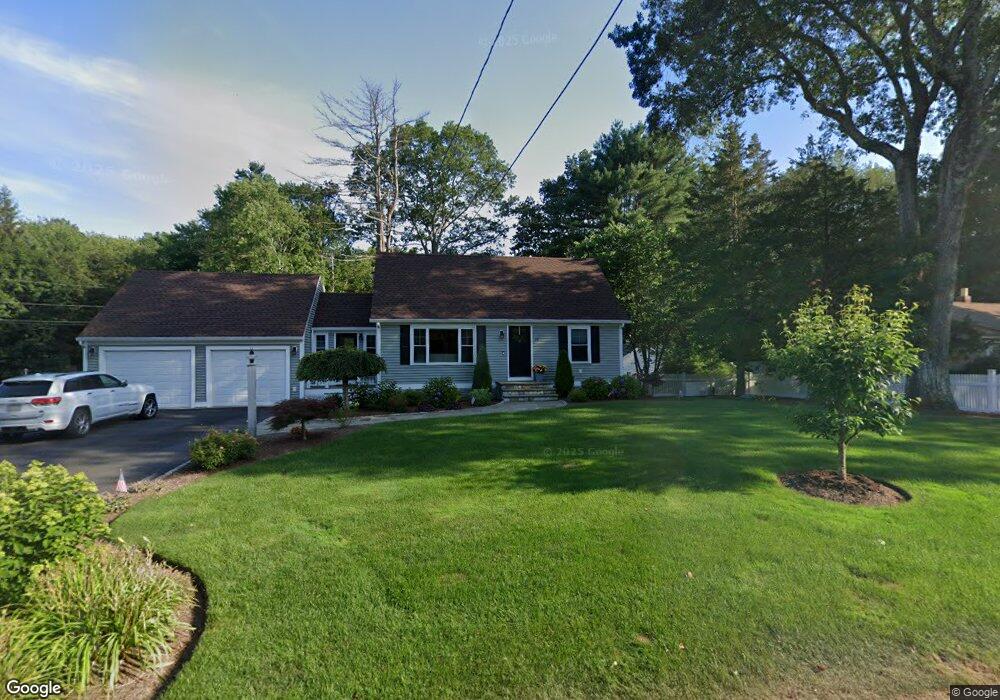
19 Walnut St Rehoboth, MA 02769
Estimated Value: $476,571 - $649,000
3
Beds
2
Baths
1,630
Sq Ft
$340/Sq Ft
Est. Value
About This Home
This home is located at 19 Walnut St, Rehoboth, MA 02769 and is currently estimated at $554,893, approximately $340 per square foot. 19 Walnut St is a home located in Bristol County with nearby schools including Dighton-Rehoboth Regional High School, Grace Baptist Christian Academy, and The Pinecroft School.
Ownership History
Date
Name
Owned For
Owner Type
Purchase Details
Closed on
Sep 24, 2020
Sold by
Pinette Deana
Bought by
Haselton Paul and Pinette Deana
Current Estimated Value
Purchase Details
Closed on
Nov 1, 2004
Sold by
Tuffile Charles D and Tuffile Michelle E
Bought by
Pinette Deana
Home Financials for this Owner
Home Financials are based on the most recent Mortgage that was taken out on this home.
Original Mortgage
$280,000
Interest Rate
5.74%
Mortgage Type
Purchase Money Mortgage
Purchase Details
Closed on
Apr 1, 2002
Sold by
Joyal Peter D and Joyal Kimberly A
Bought by
Tuffile Charles D and Tuffile Michelle E
Home Financials for this Owner
Home Financials are based on the most recent Mortgage that was taken out on this home.
Original Mortgage
$216,000
Interest Rate
6.88%
Mortgage Type
Purchase Money Mortgage
Purchase Details
Closed on
Aug 2, 1994
Sold by
Fhlmc
Bought by
Joyal Peter D and Joyal Kimberly A
Purchase Details
Closed on
May 24, 1994
Sold by
Healey James E and Healey Fhlmc
Bought by
Fhlmc
Purchase Details
Closed on
Apr 28, 1988
Sold by
Medeiros Nanccyl J
Bought by
Healey James E
Create a Home Valuation Report for This Property
The Home Valuation Report is an in-depth analysis detailing your home's value as well as a comparison with similar homes in the area
Home Values in the Area
Average Home Value in this Area
Purchase History
| Date | Buyer | Sale Price | Title Company |
|---|---|---|---|
| Haselton Paul | -- | None Available | |
| Pinette Deana | $350,000 | -- | |
| Tuffile Charles D | $240,000 | -- | |
| Joyal Peter D | $104,900 | -- | |
| Fhlmc | $100,300 | -- | |
| Healey James E | $134,000 | -- |
Source: Public Records
Mortgage History
| Date | Status | Borrower | Loan Amount |
|---|---|---|---|
| Previous Owner | Healey James E | $241,600 | |
| Previous Owner | Pinette Deana | $280,000 | |
| Previous Owner | Healey James E | $216,000 | |
| Previous Owner | Healey James E | $25,000 |
Source: Public Records
Tax History
| Year | Tax Paid | Tax Assessment Tax Assessment Total Assessment is a certain percentage of the fair market value that is determined by local assessors to be the total taxable value of land and additions on the property. | Land | Improvement |
|---|---|---|---|---|
| 2025 | $4,169 | $373,900 | $152,900 | $221,000 |
| 2024 | $3,881 | $341,600 | $152,900 | $188,700 |
| 2023 | $3,886 | $335,600 | $149,900 | $185,700 |
| 2022 | $3,758 | $296,600 | $149,900 | $146,700 |
| 2021 | $0 | $289,500 | $142,800 | $146,700 |
| 2020 | $3,737 | $284,800 | $142,800 | $142,000 |
| 2018 | $3,058 | $255,500 | $136,000 | $119,500 |
| 2017 | $3,011 | $239,700 | $136,000 | $103,700 |
| 2016 | $2,855 | $235,000 | $136,000 | $99,000 |
| 2015 | $2,940 | $238,800 | $129,500 | $109,300 |
| 2014 | $2,801 | $225,200 | $123,300 | $101,900 |
Source: Public Records
Map
Nearby Homes
- 14 Mine Brook Rd
- 20 Mine Brook Rd
- 43 Starr Ln
- 71 Agricultural Ave
- 438 Tremont St
- 3 Wilmarth St
- 27 Coleman Ave
- 240 Smith St
- 51 Saveena Dr
- 96 Mary Rocha Way
- 58 Saveena Dr
- 74 Saveena Dr
- 19 York Dr
- 78 Saveena Dr
- 154 Fairview Ave
- 49 Teaberry Ln
- 40 Duffy Dr
- 827 Pike Ave
- 23 Stockade Cir
- Lot 11 Ledge Hill Ln
Your Personal Tour Guide
Ask me questions while you tour the home.