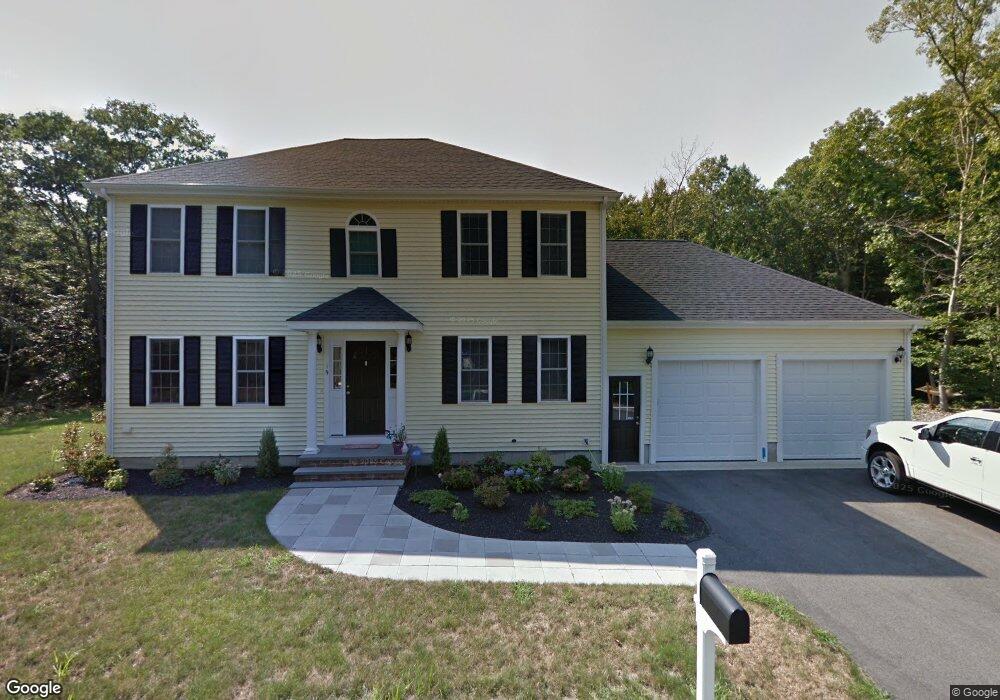
19 Wampum St Weymouth, MA 02190
South Weymouth NeighborhoodEstimated Value: $905,763 - $1,142,000
3
Beds
3
Baths
2,016
Sq Ft
$515/Sq Ft
Est. Value
About This Home
This home is located at 19 Wampum St, Weymouth, MA 02190 and is currently estimated at $1,037,441, approximately $514 per square foot. 19 Wampum St is a home located in Norfolk County with nearby schools including Thomas V Nash, Abigail Adams Middle School, and Weymouth Middle School Chapman.
Ownership History
Date
Name
Owned For
Owner Type
Purchase Details
Closed on
Apr 29, 2011
Sold by
Lot 2 Wampum Street Rt
Bought by
Mayo Richard J and Mayo Laurie A
Current Estimated Value
Home Financials for this Owner
Home Financials are based on the most recent Mortgage that was taken out on this home.
Original Mortgage
$489,230
Outstanding Balance
$331,891
Interest Rate
4.37%
Mortgage Type
FHA
Estimated Equity
$705,550
Purchase Details
Closed on
Jun 30, 2006
Sold by
Kennedy John F
Bought by
2 Wampum Street Rt
Create a Home Valuation Report for This Property
The Home Valuation Report is an in-depth analysis detailing your home's value as well as a comparison with similar homes in the area
Home Values in the Area
Average Home Value in this Area
Purchase History
| Date | Buyer | Sale Price | Title Company |
|---|---|---|---|
| Mayo Richard J | $502,000 | -- | |
| 2 Wampum Street Rt | $167,500 | -- |
Source: Public Records
Mortgage History
| Date | Status | Borrower | Loan Amount |
|---|---|---|---|
| Open | Mayo Richard J | $489,230 |
Source: Public Records
Tax History Compared to Growth
Tax History
| Year | Tax Paid | Tax Assessment Tax Assessment Total Assessment is a certain percentage of the fair market value that is determined by local assessors to be the total taxable value of land and additions on the property. | Land | Improvement |
|---|---|---|---|---|
| 2025 | $9,158 | $906,700 | $217,600 | $689,100 |
| 2024 | $8,853 | $862,000 | $207,300 | $654,700 |
| 2023 | $8,681 | $830,700 | $211,100 | $619,600 |
| 2022 | $8,441 | $736,600 | $195,500 | $541,100 |
| 2021 | $7,730 | $658,400 | $195,500 | $462,900 |
| 2020 | $7,380 | $619,100 | $195,500 | $423,600 |
| 2019 | $7,455 | $615,100 | $205,100 | $410,000 |
| 2018 | $7,246 | $579,700 | $195,300 | $384,400 |
| 2017 | $7,126 | $556,300 | $186,000 | $370,300 |
| 2016 | $6,899 | $539,000 | $178,900 | $360,100 |
| 2015 | $6,584 | $510,400 | $178,900 | $331,500 |
| 2014 | $6,345 | $477,100 | $166,400 | $310,700 |
Source: Public Records
Map
Nearby Homes
- 68 Massapoag St Unit 7
- 354 Tilden Commons Ln
- 211 Randolph St
- 24 Fisher Rd
- 193 Randolph St
- 175 Tyson Commons Ln
- 16 Jay Rd
- 308 Forest St
- 134 Tyson Commons Ln
- 30 Bradford Commons Ln
- 120 Randolph St
- 50 Hollis St
- 92 Mercury St
- 262 West St
- 255 West St
- 18 Fountain Ln Unit 2
- 441 Grove St
- 655 Summer St
- 27 Park Ave
- 432 Grove St