Estimated Value: $334,608 - $464,000
--
Bed
1
Bath
2,470
Sq Ft
$154/Sq Ft
Est. Value
About This Home
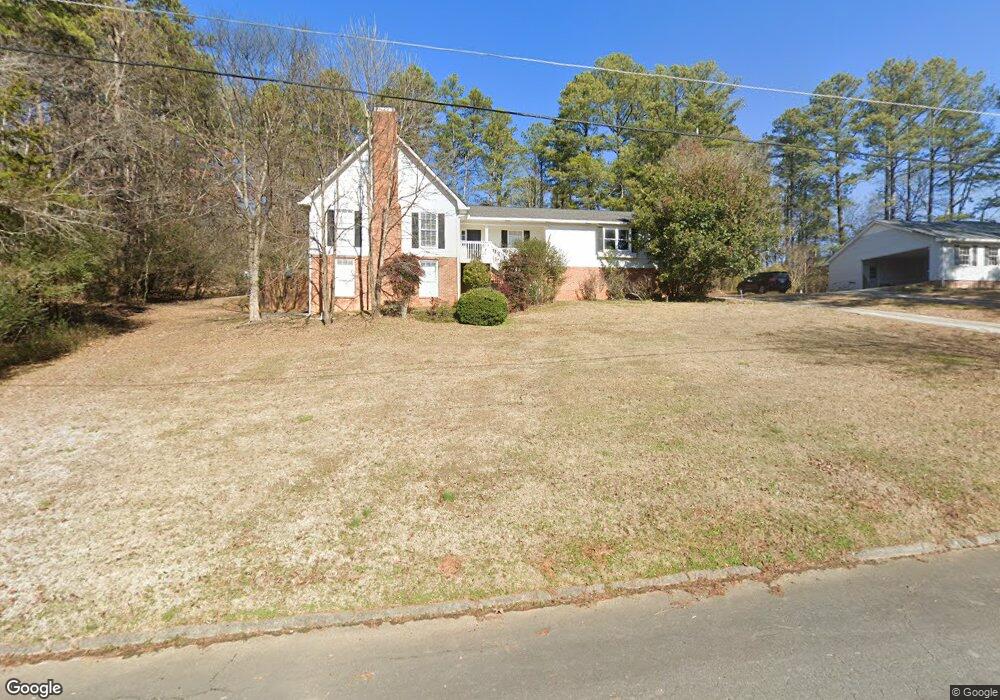
This home is located at 19 Warwick Way SE, Rome, GA 30161 and is currently estimated at $379,152, approximately $153 per square foot. 19 Warwick Way SE is a home located in Floyd County with nearby schools including Pepperell Middle School, Pepperell High School, and Montessori School of Rome.
Ownership History
Date
Name
Owned For
Owner Type
Purchase Details
Closed on
Aug 9, 2002
Sold by
Martinez Carlos Q and Martinez Teresa G
Bought by
Cater Gregory W and Cater Robin L
Current Estimated Value
Purchase Details
Closed on
Dec 13, 1993
Sold by
Russell Thomas T and Russell Marshall B
Bought by
Martinez Carlos Q and Martinez Teresa G
Purchase Details
Closed on
Dec 1, 1992
Sold by
Mitchell Bobby Lee and Lee Ann
Bought by
Russell Thomas T and Russe Marshall B
Purchase Details
Closed on
Jun 17, 1988
Sold by
Smith Robert E and Mary Lucille
Bought by
Mitchell Bobby Lee and Lee Ann
Purchase Details
Closed on
Jul 8, 1983
Sold by
Spears Herman Edward and Spears Judith C
Bought by
Smith Robert E and Mary Lucille
Purchase Details
Closed on
Oct 5, 1979
Sold by
Hammond James A
Bought by
Spears Herman Edward and Spears Judith C
Purchase Details
Closed on
Sep 29, 1978
Sold by
Custom Home Builders Inc
Bought by
Hammond James A
Purchase Details
Closed on
Aug 23, 1977
Sold by
N R S Properties Inc
Bought by
Custom Home Builders Inc
Purchase Details
Closed on
Jun 12, 1975
Bought by
N R S Properties Inc
Create a Home Valuation Report for This Property
The Home Valuation Report is an in-depth analysis detailing your home's value as well as a comparison with similar homes in the area
Home Values in the Area
Average Home Value in this Area
Purchase History
| Date | Buyer | Sale Price | Title Company |
|---|---|---|---|
| Cater Gregory W | $135,000 | -- | |
| Martinez Carlos Q | $139,900 | -- | |
| Russell Thomas T | $125,000 | -- | |
| Mitchell Bobby Lee | $115,000 | -- | |
| Smith Robert E | $41,000 | -- | |
| Spears Herman Edward | $68,400 | -- | |
| Hammond James A | $57,000 | -- | |
| Custom Home Builders Inc | -- | -- | |
| N R S Properties Inc | -- | -- |
Source: Public Records
Tax History Compared to Growth
Tax History
| Year | Tax Paid | Tax Assessment Tax Assessment Total Assessment is a certain percentage of the fair market value that is determined by local assessors to be the total taxable value of land and additions on the property. | Land | Improvement |
|---|---|---|---|---|
| 2024 | $2,966 | $125,520 | $9,370 | $116,150 |
| 2023 | $3,051 | $116,267 | $8,268 | $107,999 |
| 2022 | $2,688 | $98,690 | $6,614 | $92,076 |
| 2021 | $2,529 | $89,052 | $6,614 | $82,438 |
| 2020 | $2,372 | $79,602 | $5,236 | $74,366 |
| 2019 | $2,132 | $71,782 | $5,236 | $66,546 |
| 2018 | $2,042 | $68,771 | $5,236 | $63,535 |
| 2017 | $1,937 | $65,122 | $5,236 | $59,886 |
| 2016 | $1,936 | $64,332 | $5,200 | $59,132 |
| 2015 | $1,977 | $65,212 | $5,200 | $60,012 |
| 2014 | $1,977 | $66,972 | $5,200 | $61,772 |
Source: Public Records
Map
Nearby Homes
- 0 Warwick Way SE Unit 10624495
- 0 Warwick Way SE Unit 7666193
- 111 Warwick Way SE
- 85 Cambridge Dr SE
- 113 Warwick Way SE
- 18 Devonshire Dr SE
- 11 Cambridge Dr SE
- 0 Camelot Cir SE Unit 7662985
- 0 Camelot Cir SE Unit 10621392
- 7 Rushden Way SE
- 0 Wellington Way SE Unit 7374602
- 0 Wellington Way SE Unit 20180068
- 0 Wellington Way SE Unit 7374604
- 0 Wellington Way SE Unit 20180069
- 3 Rushden Way SE
- 52 Twickenham Rd SE
- 28 Rushden Way SE
- 9 Wellington Way SE
- 30 Rushden Way SE
- 14 Wellington Way SE
- 21 Warwick Way SE
- 7 Canterbury Ct SE Unit Studio Apartment
- 7 Canterbury Ct SE
- 15 Warwick Way SE Unit 48
- 18 Warwick Way SE
- 11 Warwick Way SE Unit 46
- 10 Dover Dr SE
- 5 Canterbury Ct SE
- 6 Canterbury Ct SE
- 8 Dover Dr SE
- 12 Dover Dr SE
- 0 Warwick Way SE Unit 6025210
- 0 Warwick Way SE Unit 17 8395922
- 0 Warwick Way SE Unit 34 7305505
- 0 Warwick Way SE Unit 34 7368518
- 0 Warwick Way SE
- 0 Warwick Way SE Unit 20129016
- 0 Warwick Way SE Unit LOT 48 20124498
- 0 Warwick Way SE Unit 10051253
- 0 Warwick Way SE Unit 7053813