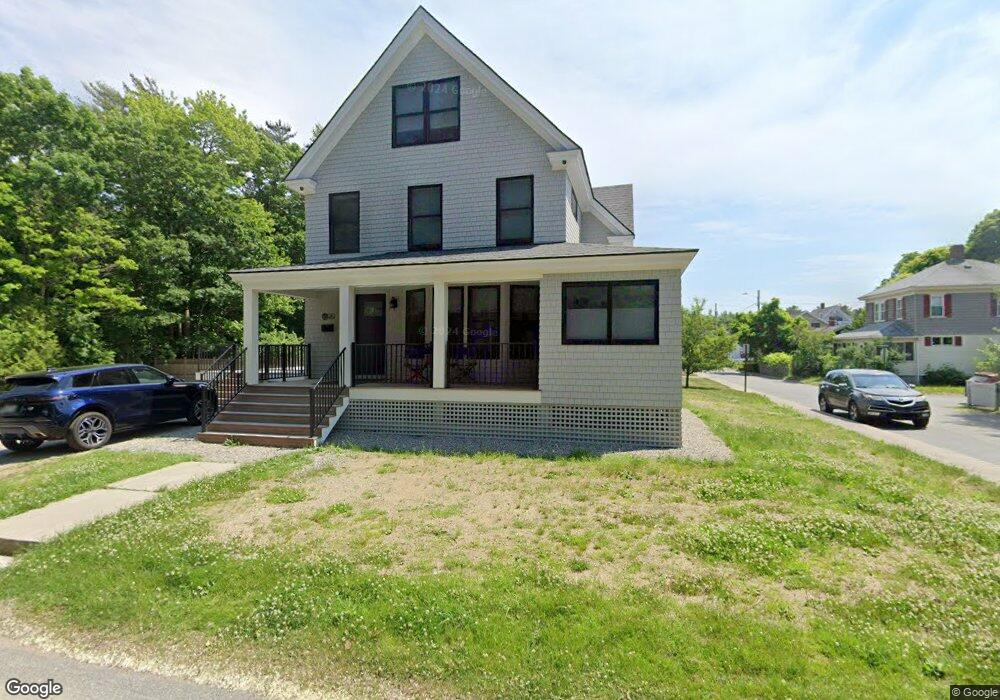
19 Wayman Ln Unit 1 Bar Harbor, ME 04609
Estimated Value: $1,142,000 - $1,383,000
5
Beds
4
Baths
2,540
Sq Ft
$512/Sq Ft
Est. Value
About This Home
This home is located at 19 Wayman Ln Unit 1, Bar Harbor, ME 04609 and is currently estimated at $1,299,732, approximately $511 per square foot. 19 Wayman Ln Unit 1 is a home located in Hancock County with nearby schools including Conners-Emerson School, Mt. Desert Island High School, and Acadia School.
Ownership History
Date
Name
Owned For
Owner Type
Purchase Details
Closed on
Mar 10, 2023
Sold by
Barharbor Town Of
Bought by
Tweedie James K and Macquinn-Tweedie Lisa A
Current Estimated Value
Purchase Details
Closed on
Feb 14, 2023
Sold by
Iht Leased Land Llc
Bought by
Tweedie Lisa A and Tweedie James K
Purchase Details
Closed on
Nov 28, 2022
Sold by
Macomber Robert W
Bought by
L Morgan T H
Purchase Details
Closed on
Mar 29, 2022
Sold by
Tweedie James K and Macquinn-Tweedie Lisa
Bought by
Macomber Robert W
Create a Home Valuation Report for This Property
The Home Valuation Report is an in-depth analysis detailing your home's value as well as a comparison with similar homes in the area
Home Values in the Area
Average Home Value in this Area
Purchase History
| Date | Buyer | Sale Price | Title Company |
|---|---|---|---|
| Tweedie James K | -- | None Available | |
| Tweedie Lisa A | -- | None Available | |
| Tweedie Lisa A | -- | None Available | |
| L Morgan T H | $1,100,000 | None Available | |
| Macomber Robert W | -- | None Available |
Source: Public Records
Tax History Compared to Growth
Tax History
| Year | Tax Paid | Tax Assessment Tax Assessment Total Assessment is a certain percentage of the fair market value that is determined by local assessors to be the total taxable value of land and additions on the property. | Land | Improvement |
|---|---|---|---|---|
| 2024 | $9,049 | $901,300 | $417,000 | $484,300 |
| 2023 | $4,764 | $548,800 | $417,000 | $131,800 |
| 2022 | $5,244 | $562,700 | $352,900 | $209,800 |
| 2021 | $4,982 | $511,500 | $320,800 | $190,700 |
| 2020 | $3,550 | $298,300 | $124,900 | $173,400 |
| 2019 | $3,500 | $295,400 | $123,700 | $171,700 |
| 2018 | $3,415 | $295,400 | $123,700 | $171,700 |
| 2017 | $3,238 | $295,400 | $123,700 | $171,700 |
| 2016 | $3,170 | $295,400 | $123,700 | $171,700 |
| 2015 | $3,128 | $295,400 | $123,700 | $171,700 |
| 2014 | $3,019 | $295,400 | $123,700 | $171,700 |
| 2012 | $2,907 | $295,400 | $123,700 | $171,700 |
Source: Public Records
Map
Nearby Homes