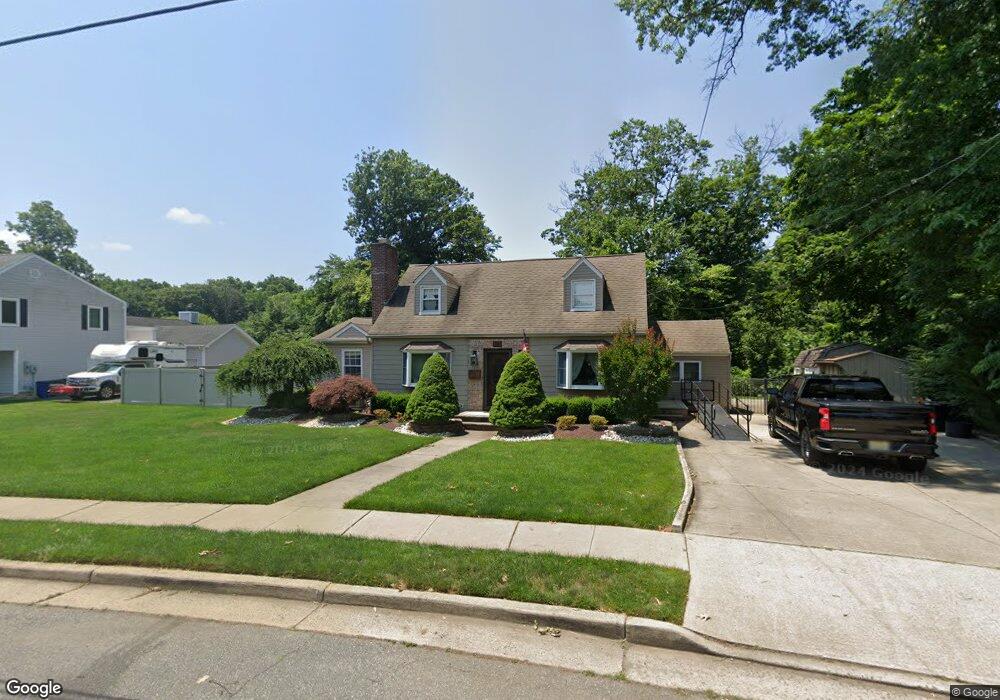
19 Weldon Rd Matawan, NJ 07747
Estimated Value: $731,000 - $854,691
4
Beds
3
Baths
2,261
Sq Ft
$356/Sq Ft
Est. Value
About This Home
This home is located at 19 Weldon Rd, Matawan, NJ 07747 and is currently estimated at $805,423, approximately $356 per square foot. 19 Weldon Rd is a home located in Monmouth County with nearby schools including Matawan Reg High School, Matawan Montessori Academy, and St. Joseph Elementary School.
Ownership History
Date
Name
Owned For
Owner Type
Purchase Details
Closed on
Jun 14, 2019
Sold by
Fahrion Kim and Schirmer Guzman Kimberly M
Bought by
Fahrion Vincent and Fahrion Kim
Current Estimated Value
Home Financials for this Owner
Home Financials are based on the most recent Mortgage that was taken out on this home.
Original Mortgage
$244,450
Outstanding Balance
$214,496
Interest Rate
4%
Mortgage Type
New Conventional
Estimated Equity
$590,927
Purchase Details
Closed on
May 18, 2010
Sold by
Burlew Darrin A and Burlew Nancy
Bought by
Guzman Adolfo and Schirmer Guzman Kimberly M
Purchase Details
Closed on
Jul 20, 2009
Sold by
Guzman Adolfo
Bought by
Schirmer Guzman Kimberly M
Purchase Details
Closed on
Jul 5, 2006
Sold by
Burlew Darrin A
Bought by
Guzman Adolfo and Guzman Kimberly M Schirmer
Create a Home Valuation Report for This Property
The Home Valuation Report is an in-depth analysis detailing your home's value as well as a comparison with similar homes in the area
Home Values in the Area
Average Home Value in this Area
Purchase History
| Date | Buyer | Sale Price | Title Company |
|---|---|---|---|
| Fahrion Vincent | -- | Amrock Inc | |
| Guzman Adolfo | $473,900 | None Available | |
| Schirmer Guzman Kimberly M | -- | None Available | |
| Guzman Adolfo | $473,900 | -- |
Source: Public Records
Mortgage History
| Date | Status | Borrower | Loan Amount |
|---|---|---|---|
| Open | Fahrion Vincent | $244,450 |
Source: Public Records
Tax History
| Year | Tax Paid | Tax Assessment Tax Assessment Total Assessment is a certain percentage of the fair market value that is determined by local assessors to be the total taxable value of land and additions on the property. | Land | Improvement |
|---|---|---|---|---|
| 2025 | $14,165 | $777,200 | $384,300 | $392,900 |
| 2024 | $13,820 | $648,900 | $336,300 | $312,600 |
| 2023 | $13,820 | $635,700 | $326,300 | $309,400 |
| 2022 | $13,916 | $588,400 | $293,800 | $294,600 |
| 2021 | $10,371 | $512,200 | $243,800 | $268,400 |
| 2020 | $13,653 | $499,000 | $233,800 | $265,200 |
| 2019 | $12,965 | $474,900 | $216,300 | $258,600 |
| 2018 | $12,673 | $456,700 | $201,300 | $255,400 |
| 2017 | $12,575 | $446,700 | $196,300 | $250,400 |
| 2016 | $12,223 | $443,500 | $196,300 | $247,200 |
| 2015 | $11,421 | $417,600 | $191,300 | $226,300 |
| 2014 | $11,320 | $401,700 | $181,300 | $220,400 |
Source: Public Records
Map
Nearby Homes
- 4377 Old Bridge Matawan Rd
- 9 Crabtree Rd
- 48 Charles St
- 45 Beechwood Terrace
- 27 Middlesex Rd
- 14 New Brunswick Ave
- 15 Walnut Ct
- 258 Jackson St
- 320 Main St
- 8 Sutphin Ave
- 272 Main St
- 49 Middlesex Rd Unit B
- 49 Middlesex Rd Unit A
- 33 Samantha Cir
- 43 Pemberton Dr
- 101 Ravine Dr
- 65 Ravine Dr
- 12 Coventry Ct
- 190 Jackson St
- 255 Harding Blvd
Your Personal Tour Guide
Ask me questions while you tour the home.