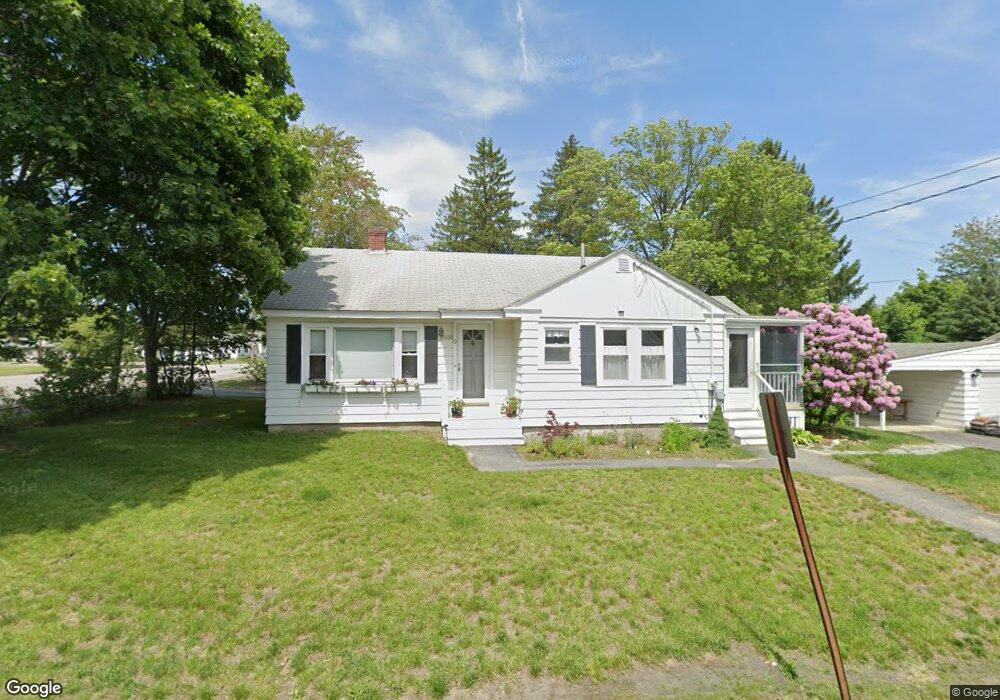
19 West St Biddeford, ME 04005
Estimated Value: $371,000 - $418,000
3
Beds
1
Bath
1,100
Sq Ft
$358/Sq Ft
Est. Value
About This Home
This home is located at 19 West St, Biddeford, ME 04005 and is currently estimated at $394,308, approximately $358 per square foot. 19 West St is a home located in York County with nearby schools including John F Kennedy Memorial School, Biddeford Primary School, and Biddeford Intermediate School.
Ownership History
Date
Name
Owned For
Owner Type
Purchase Details
Closed on
May 31, 2019
Sold by
Marquis Lorraine Y Est
Bought by
Marquis Lynne B
Current Estimated Value
Home Financials for this Owner
Home Financials are based on the most recent Mortgage that was taken out on this home.
Original Mortgage
$162,993
Outstanding Balance
$142,116
Interest Rate
4.2%
Mortgage Type
FHA
Estimated Equity
$252,192
Create a Home Valuation Report for This Property
The Home Valuation Report is an in-depth analysis detailing your home's value as well as a comparison with similar homes in the area
Home Values in the Area
Average Home Value in this Area
Purchase History
| Date | Buyer | Sale Price | Title Company |
|---|---|---|---|
| Marquis Lynne B | -- | -- |
Source: Public Records
Mortgage History
| Date | Status | Borrower | Loan Amount |
|---|---|---|---|
| Open | Marquis Lynne B | $162,993 |
Source: Public Records
Tax History
| Year | Tax Paid | Tax Assessment Tax Assessment Total Assessment is a certain percentage of the fair market value that is determined by local assessors to be the total taxable value of land and additions on the property. | Land | Improvement |
|---|---|---|---|---|
| 2025 | $3,995 | $267,400 | $135,600 | $131,800 |
| 2024 | $3,767 | $264,900 | $135,600 | $129,300 |
| 2023 | $3,444 | $262,500 | $133,200 | $129,300 |
| 2022 | $3,266 | $199,000 | $73,900 | $125,100 |
| 2021 | $3,090 | $169,500 | $62,500 | $107,000 |
| 2020 | $3,134 | $156,300 | $56,800 | $99,500 |
| 2019 | $3,123 | $156,300 | $56,800 | $99,500 |
| 2018 | $3,079 | $156,300 | $56,800 | $99,500 |
| 2017 | $2,986 | $148,800 | $56,800 | $92,000 |
| 2016 | $2,955 | $148,800 | $56,800 | $92,000 |
| 2015 | $2,586 | $148,800 | $56,800 | $92,000 |
| 2014 | $2,522 | $148,800 | $56,800 | $92,000 |
| 2013 | -- | $155,900 | $56,400 | $99,500 |
Source: Public Records
Map
Nearby Homes
Your Personal Tour Guide
Ask me questions while you tour the home.