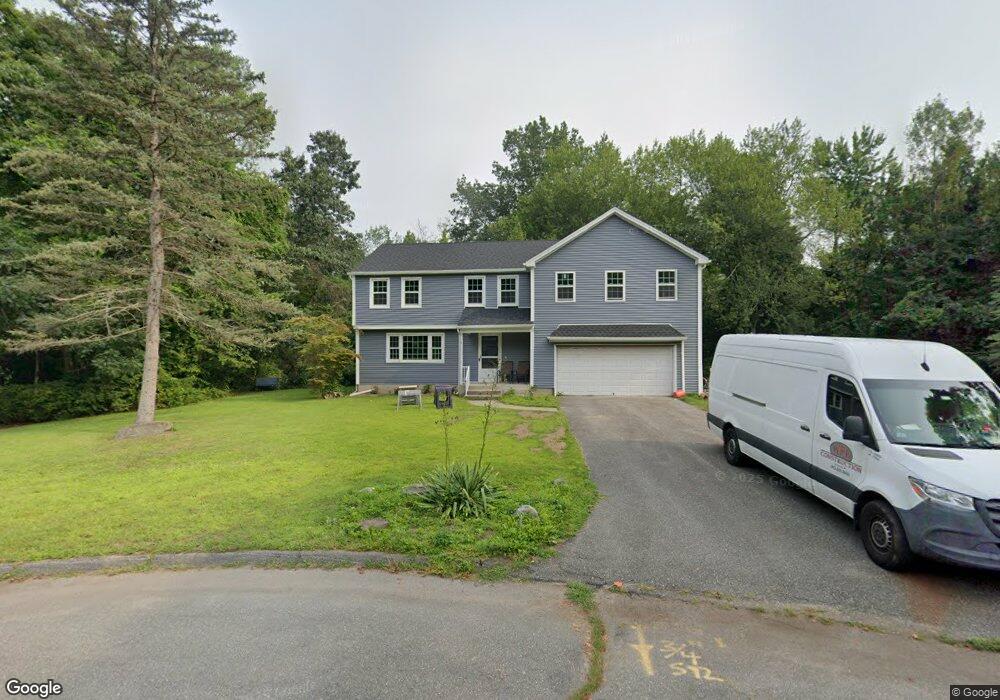
19 Westernview Dr Wilbraham, MA 01095
Estimated Value: $345,000 - $462,000
3
Beds
2
Baths
1,900
Sq Ft
$218/Sq Ft
Est. Value
About This Home
This home is located at 19 Westernview Dr, Wilbraham, MA 01095 and is currently estimated at $413,936, approximately $217 per square foot. 19 Westernview Dr is a home located in Hampden County with nearby schools including Minnechaug Regional High School and Wilbraham & Monson Academy.
Ownership History
Date
Name
Owned For
Owner Type
Purchase Details
Closed on
Jan 11, 2025
Sold by
Kathleen A Czupryna T A and Kathleen Murphy
Bought by
19 Western View Rt and Arnold
Current Estimated Value
Home Financials for this Owner
Home Financials are based on the most recent Mortgage that was taken out on this home.
Original Mortgage
$390,000
Outstanding Balance
$386,622
Interest Rate
6.85%
Mortgage Type
Purchase Money Mortgage
Estimated Equity
$27,314
Purchase Details
Closed on
Aug 25, 1982
Bought by
Czupryna Walter W and Czupryna Mary T
Create a Home Valuation Report for This Property
The Home Valuation Report is an in-depth analysis detailing your home's value as well as a comparison with similar homes in the area
Home Values in the Area
Average Home Value in this Area
Purchase History
| Date | Buyer | Sale Price | Title Company |
|---|---|---|---|
| 19 Western View Rt | $330,000 | None Available | |
| 19 Western View Rt | $330,000 | None Available | |
| Czupryna Walter W | -- | -- |
Source: Public Records
Mortgage History
| Date | Status | Borrower | Loan Amount |
|---|---|---|---|
| Open | 19 Western View Rt | $390,000 | |
| Closed | 19 Western View Rt | $390,000 |
Source: Public Records
Tax History Compared to Growth
Tax History
| Year | Tax Paid | Tax Assessment Tax Assessment Total Assessment is a certain percentage of the fair market value that is determined by local assessors to be the total taxable value of land and additions on the property. | Land | Improvement |
|---|---|---|---|---|
| 2025 | $6,676 | $373,400 | $97,200 | $276,200 |
| 2024 | $6,501 | $351,400 | $97,200 | $254,200 |
| 2023 | $61 | $324,100 | $97,200 | $226,900 |
| 2022 | $6,075 | $296,500 | $97,200 | $199,300 |
| 2021 | $5,924 | $258,000 | $106,400 | $151,600 |
| 2020 | $5,774 | $258,000 | $106,400 | $151,600 |
| 2019 | $5,624 | $258,000 | $106,400 | $151,600 |
| 2018 | $5,637 | $249,000 | $106,400 | $142,600 |
| 2017 | $5,478 | $249,000 | $106,400 | $142,600 |
| 2016 | $5,363 | $248,300 | $112,800 | $135,500 |
| 2015 | $5,185 | $248,300 | $112,800 | $135,500 |
Source: Public Records
Map
Nearby Homes