Estimated Value: $408,458 - $470,000
5
Beds
5
Baths
4,397
Sq Ft
$102/Sq Ft
Est. Value
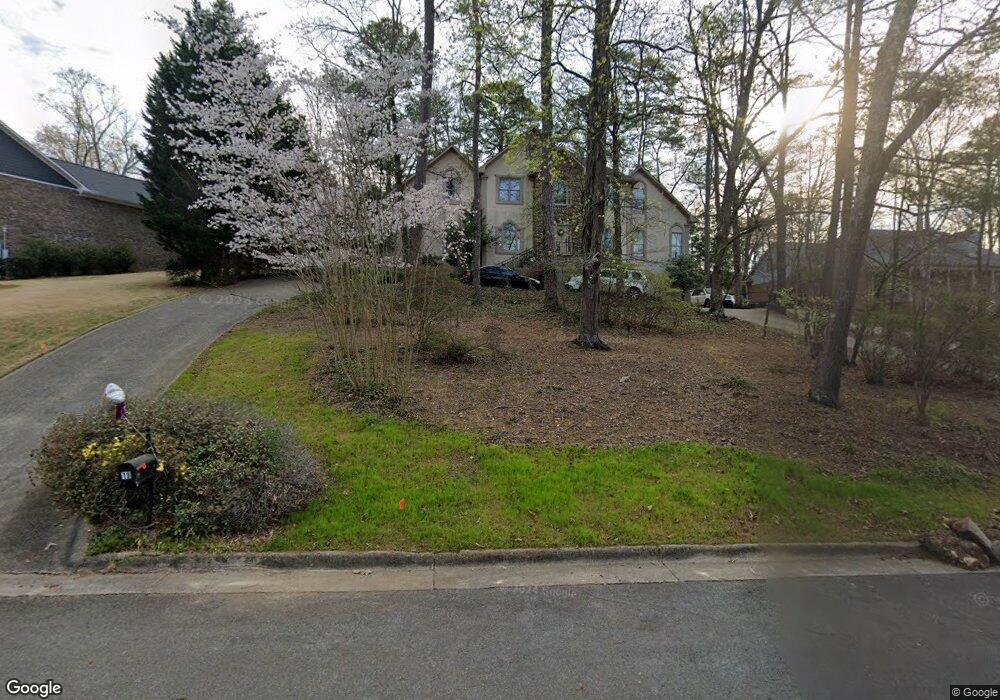
About This Home
This home is located at 19 Westover Dr SW, Rome, GA 30165 and is currently estimated at $449,115, approximately $102 per square foot. 19 Westover Dr SW is a home located in Floyd County with nearby schools including Rome High School.
Ownership History
Date
Name
Owned For
Owner Type
Purchase Details
Closed on
Oct 16, 2020
Sold by
Mcniece Douglas E
Bought by
Insel Kathy J and Brown William Barry
Current Estimated Value
Home Financials for this Owner
Home Financials are based on the most recent Mortgage that was taken out on this home.
Original Mortgage
$269,705
Outstanding Balance
$239,451
Interest Rate
2.8%
Mortgage Type
New Conventional
Estimated Equity
$209,664
Purchase Details
Closed on
Dec 30, 1993
Sold by
Timms Billy
Bought by
Mcniece Douglas E and Evelyn Mcnie
Purchase Details
Closed on
Jun 14, 1991
Sold by
Easterwood Mark
Bought by
Timms Billy
Purchase Details
Closed on
Aug 31, 1989
Sold by
Wright Richard E
Bought by
Easterwood Mark
Purchase Details
Closed on
Mar 26, 1987
Sold by
Buffington Buffington J and Buffington June C
Bought by
Wright Richard E
Purchase Details
Closed on
Mar 28, 1984
Bought by
Buffington Buffington J and Buffington June C
Create a Home Valuation Report for This Property
The Home Valuation Report is an in-depth analysis detailing your home's value as well as a comparison with similar homes in the area
Home Values in the Area
Average Home Value in this Area
Purchase History
| Date | Buyer | Sale Price | Title Company |
|---|---|---|---|
| Insel Kathy J | $283,900 | -- | |
| Mcniece Douglas E | $232,000 | -- | |
| Timms Billy | $210,000 | -- | |
| Easterwood Mark | $20,000 | -- | |
| Wright Richard E | -- | -- | |
| Buffington Buffington J | -- | -- |
Source: Public Records
Mortgage History
| Date | Status | Borrower | Loan Amount |
|---|---|---|---|
| Open | Insel Kathy J | $269,705 |
Source: Public Records
Tax History Compared to Growth
Tax History
| Year | Tax Paid | Tax Assessment Tax Assessment Total Assessment is a certain percentage of the fair market value that is determined by local assessors to be the total taxable value of land and additions on the property. | Land | Improvement |
|---|---|---|---|---|
| 2024 | $5,933 | $167,295 | $21,824 | $145,471 |
| 2023 | $5,879 | $172,661 | $19,840 | $152,821 |
| 2022 | $5,339 | $146,316 | $16,368 | $129,948 |
| 2021 | $4,214 | $127,091 | $16,368 | $110,723 |
| 2020 | $3,774 | $118,655 | $12,400 | $106,255 |
| 2019 | $4,439 | $121,199 | $12,400 | $108,799 |
| 2018 | $4,226 | $115,444 | $12,400 | $103,044 |
| 2017 | $4,008 | $109,528 | $12,400 | $97,128 |
| 2016 | $3,963 | $108,000 | $12,400 | $95,600 |
| 2015 | $3,901 | $109,240 | $12,400 | $96,840 |
| 2014 | $3,901 | $112,505 | $12,400 | $100,105 |
Source: Public Records
Map
Nearby Homes
- 30 Westover Dr SW
- 9 Ladonna Place SW
- 15 Ladonna Place SW
- 1 Westlyn Dr SW
- 0 Westlyn Dr Unit 10599621
- 0 Westlyn Dr Unit 7645405
- 106 Kenwood Dr SW
- 108 Deerbrook Dr SW
- 10 Thornwood Dr SW
- 3 Lovell Ln SW
- 203 Hycliff Rd SW
- 25 Ridge Dr SW
- 2604 Shorter Ave NW
- 3 Oak Ridge Ct NE
- 216 Coosawattee Ave SW
- 52 Glenda Dr SW
- 200 Coosawattee Ave SW
- 8 Bush Arbor Place SW
- 10 Bush Arbor Place SW
- 120 Thornwood Dr SW
- 21 Westover Dr SW
- 17 Westover Dr SW
- 9 Gregory Dr SW
- 13 Westover Dr SW
- 26 Westover Dr SW
- 7 Gregory Dr SW
- 28 Westover Dr SW
- 22 Westover Dr SW
- 14 Westover Dr SW
- 16 Westover Dr SW
- 24 Westover Dr SW
- 18 Westover Dr SW
- 12 Westover Dr SW
- 20 Westover Dr SW
- 32 Westover Dr SW
- 10 Gregory Dr SW
- 8 Gregory Dr SW
- 3 Ladonna Place SW
- 10 Ladonna Place SW
- 10 Ladonna Place SW Unit Sec 2