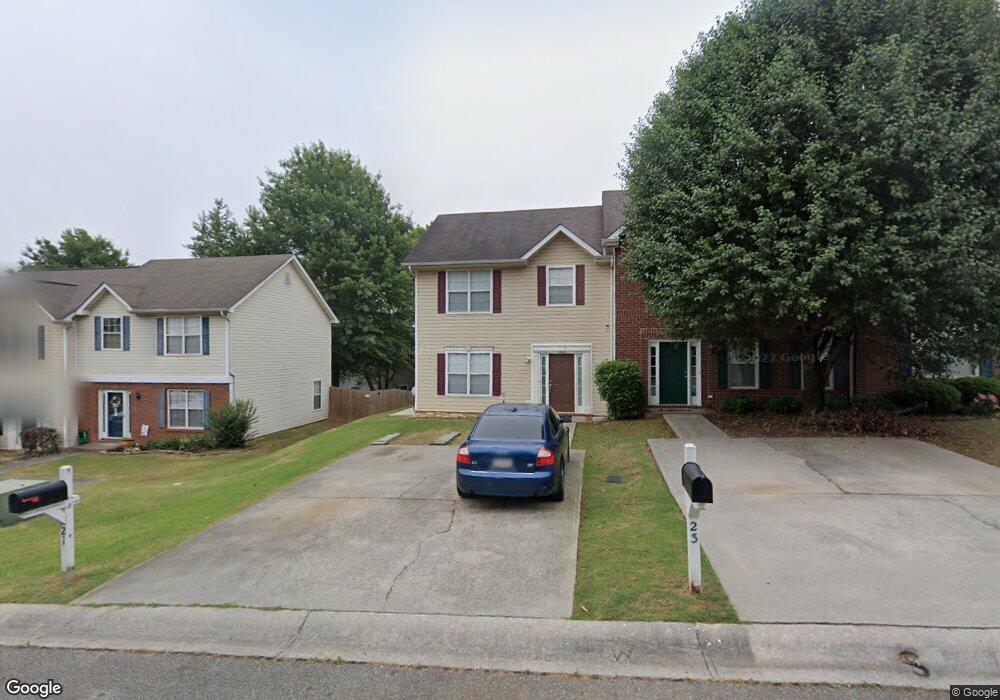
19 Westside Chase SW Unit 19 Cartersville, GA 30120
Estimated Value: $194,000 - $225,000
2
Beds
3
Baths
1,248
Sq Ft
$169/Sq Ft
Est. Value
About This Home
This home is located at 19 Westside Chase SW Unit 19, Cartersville, GA 30120 and is currently estimated at $211,115, approximately $169 per square foot. 19 Westside Chase SW Unit 19 is a home located in Bartow County with nearby schools including Taylorsville Elementary School, Woodland Middle School, and Woodland High School.
Ownership History
Date
Name
Owned For
Owner Type
Purchase Details
Closed on
Mar 27, 2017
Sold by
Mundell Amy K
Bought by
Wilson Constance E
Current Estimated Value
Home Financials for this Owner
Home Financials are based on the most recent Mortgage that was taken out on this home.
Original Mortgage
$87,092
Outstanding Balance
$72,374
Interest Rate
4.16%
Mortgage Type
FHA
Estimated Equity
$138,741
Purchase Details
Closed on
Sep 12, 2011
Sold by
Mundell Amy K
Bought by
Mundell Amy K
Home Financials for this Owner
Home Financials are based on the most recent Mortgage that was taken out on this home.
Original Mortgage
$48,634
Interest Rate
4.38%
Mortgage Type
FHA
Purchase Details
Closed on
Mar 11, 2011
Sold by
Lynch Bobbie J
Bought by
Reid Kenneth E
Purchase Details
Closed on
Jan 20, 2011
Sold by
Reid Jennifer
Bought by
Lynch Bobbie J
Purchase Details
Closed on
Dec 28, 2004
Sold by
Piccola Richard C
Bought by
Lynch Bobbie J
Create a Home Valuation Report for This Property
The Home Valuation Report is an in-depth analysis detailing your home's value as well as a comparison with similar homes in the area
Home Values in the Area
Average Home Value in this Area
Purchase History
| Date | Buyer | Sale Price | Title Company |
|---|---|---|---|
| Wilson Constance E | $88,700 | -- | |
| Mundell Amy K | -- | -- | |
| Mundell Amy K | $49,900 | -- | |
| Shanks Mundell Amy K | -- | -- | |
| Mundell Amy K | $49,900 | -- | |
| Reid Kenneth E | $40,000 | -- | |
| Lynch Bobbie J | -- | -- | |
| Lynch Bobbie J | $82,500 | -- |
Source: Public Records
Mortgage History
| Date | Status | Borrower | Loan Amount |
|---|---|---|---|
| Open | Wilson Constance E | $87,092 | |
| Previous Owner | Mundell Amy K | $48,634 |
Source: Public Records
Tax History Compared to Growth
Tax History
| Year | Tax Paid | Tax Assessment Tax Assessment Total Assessment is a certain percentage of the fair market value that is determined by local assessors to be the total taxable value of land and additions on the property. | Land | Improvement |
|---|---|---|---|---|
| 2024 | $464 | $82,536 | $10,800 | $71,736 |
| 2023 | $543 | $80,358 | $10,800 | $69,558 |
| 2022 | $732 | $59,442 | $10,800 | $48,642 |
| 2021 | $371 | $44,278 | $10,800 | $33,478 |
| 2020 | $304 | $39,478 | $6,000 | $33,478 |
| 2019 | $265 | $34,399 | $4,000 | $30,399 |
| 2018 | $256 | $33,387 | $4,000 | $29,387 |
| 2017 | $935 | $33,387 | $4,000 | $29,387 |
| 2016 | $773 | $27,400 | $3,200 | $24,200 |
| 2015 | $633 | $27,400 | $3,200 | $24,200 |
| 2014 | -- | $22,760 | $3,200 | $19,560 |
| 2013 | -- | $16,600 | $3,200 | $13,400 |
Source: Public Records
Map
Nearby Homes
- 30 Meadowbridge Dr SW
- 25 Sequoyah Trail SW
- 520 Brown Farm Rd SW
- 32 Tomahawk Dr SW
- 700 Brown Farm Rd SW
- 52 Curtis Ct SW
- 18 Foxfire Ln SW
- 33 Engineer Ln SW
- 41 Fox Fire Ln SW
- 000 Lucas Rd SW
- 21 Whistle Stop Dr SW
- 264 Euharlee Rd SW
- 11 Vintage Ct SW
- 103 Hankins Dr SW
- 44 Seattle Slew Way
- 00 Cummings Rd SE
- 20 Greenwood Dr SW
- 10 Tabasco Cat Ct
- The James Plan at The Stiles
- The McGinnis Plan at The Stiles
- 19 Westside Chase SW
- 21 Westside Chase SW
- 15 Westside Chase SW
- 23 Westside Chase SW
- 13 Westside Chase SW
- 25 Westside Chase SW Unit 25
- 25 Westside Chase SW
- 111 Westside Chase SW
- 113 Westside Chase SW
- 115 Westside Chase SW
- 117 Westside Chase SW
- 11 Westside Chase SW
- 11 Westside Chase SW Unit 11
- 109 Westside Chase SW
- 119 Westside Chase SW
- 29 Westside Chase SW
- 107 Westside Chase SW
- 18 Westside Chase SW
- 16 Westside Chase SW
- 20 Westside Chase SW