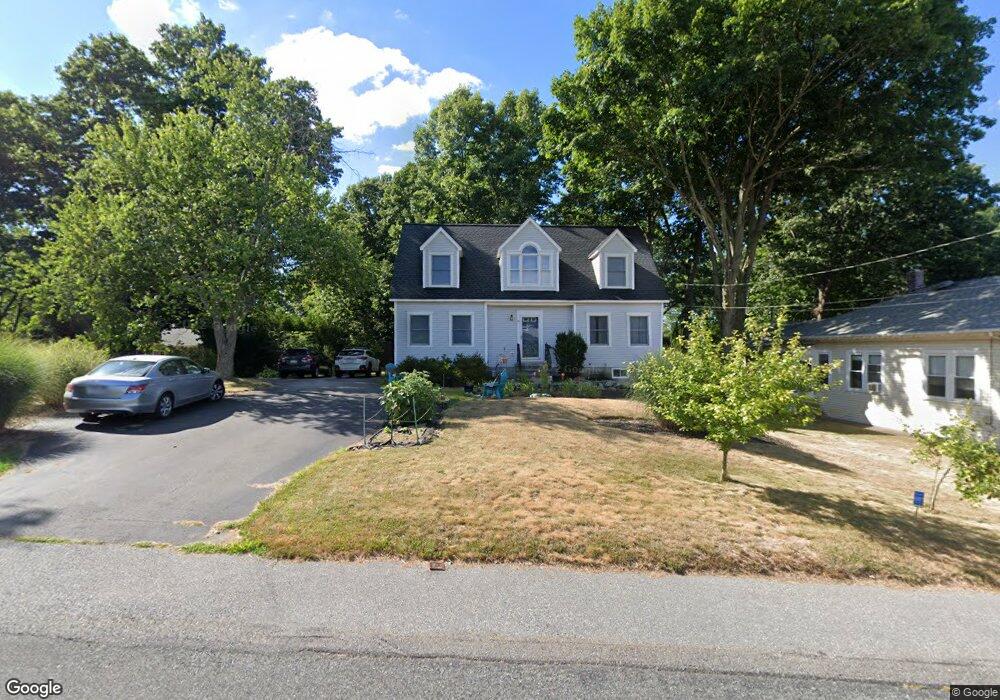
19 Whitney St Westborough, MA 01581
Estimated Value: $638,000 - $786,000
3
Beds
3
Baths
1,894
Sq Ft
$386/Sq Ft
Est. Value
About This Home
This home is located at 19 Whitney St, Westborough, MA 01581 and is currently estimated at $731,019, approximately $385 per square foot. 19 Whitney St is a home located in Worcester County with nearby schools including Westborough High School, Ebridge Montessori School, and Westboro Knowledge Beginnings.
Ownership History
Date
Name
Owned For
Owner Type
Purchase Details
Closed on
Dec 1, 2000
Sold by
Maynard Lennis D and Dempsey Craig J
Bought by
Dupree William J and Dupree Jill L
Current Estimated Value
Create a Home Valuation Report for This Property
The Home Valuation Report is an in-depth analysis detailing your home's value as well as a comparison with similar homes in the area
Home Values in the Area
Average Home Value in this Area
Purchase History
| Date | Buyer | Sale Price | Title Company |
|---|---|---|---|
| Dupree William J | $174,900 | -- |
Source: Public Records
Mortgage History
| Date | Status | Borrower | Loan Amount |
|---|---|---|---|
| Open | Dupree William J | $315,000 | |
| Closed | Dupree William J | $336,000 | |
| Closed | Dupree William J | $300,700 |
Source: Public Records
Tax History Compared to Growth
Tax History
| Year | Tax Paid | Tax Assessment Tax Assessment Total Assessment is a certain percentage of the fair market value that is determined by local assessors to be the total taxable value of land and additions on the property. | Land | Improvement |
|---|---|---|---|---|
| 2025 | $10,279 | $631,000 | $322,800 | $308,200 |
| 2024 | $9,766 | $595,100 | $300,100 | $295,000 |
| 2023 | $9,323 | $553,600 | $280,700 | $272,900 |
| 2022 | $8,798 | $475,800 | $225,400 | $250,400 |
| 2021 | $8,775 | $473,300 | $222,900 | $250,400 |
| 2020 | $8,444 | $460,900 | $210,500 | $250,400 |
| 2019 | $7,860 | $428,800 | $202,300 | $226,500 |
| 2018 | $7,107 | $385,000 | $185,800 | $199,200 |
| 2017 | $6,871 | $386,000 | $185,800 | $200,200 |
| 2016 | $6,580 | $370,300 | $185,800 | $184,500 |
| 2015 | $6,445 | $346,700 | $185,800 | $160,900 |
Source: Public Records
Map
Nearby Homes
- 6 Folly Ln
- 43 Church St
- 18 Church St
- 19 Fisher St
- 8 West St
- 14 Grove St Unit 2
- 14 Grove St Unit 3
- 7 Jennings Rd
- 44 South St
- 22 Harvey Ln
- 7 Mayberry Dr Unit H
- 9 Mayberry Dr Unit 1
- 8 Mayberry Dr Unit 5
- 75 South St
- 14C Mayberry Dr Unit 1
- 19 Treetop Park Unit 19
- 9 Treetop Park
- 15 Beach St
- 52 Treetop Park Unit 52
- 4 Fairview Rd