
19 Wilmarth Rd Randolph, MA 02368
Downtown Randolph Neighborhood
4
Beds
2
Baths
2,460
Sq Ft
7,405
Sq Ft Lot
Highlights
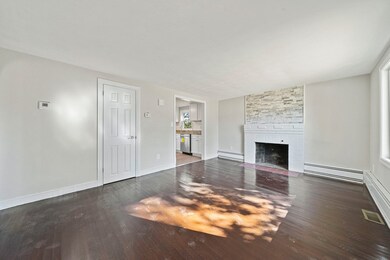
- Wood Flooring
- 2 Cooling Zones
- 4-minute walk to Holbrook/Randolph
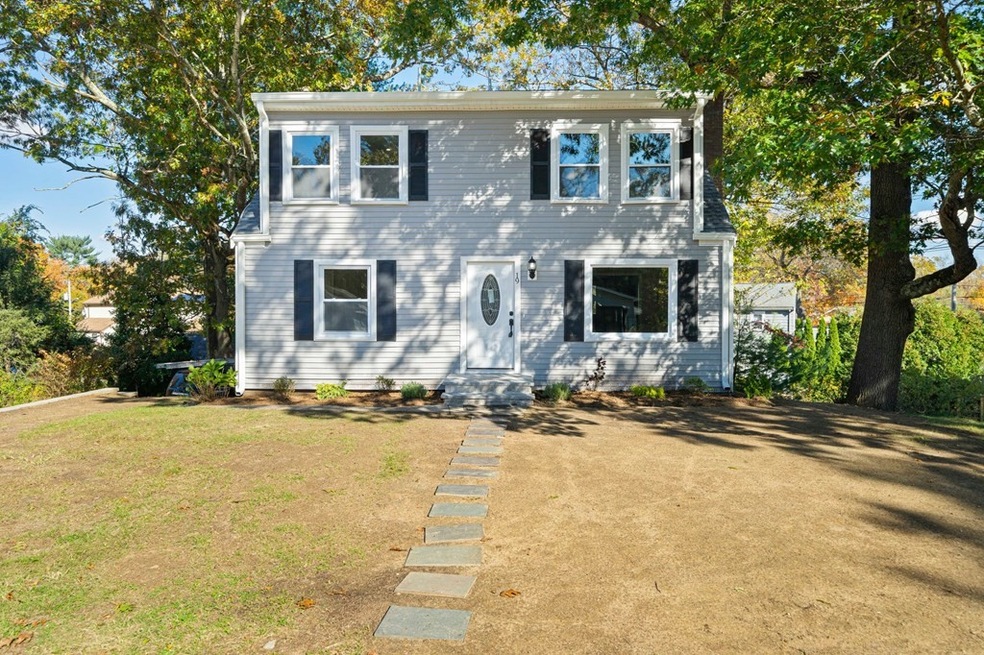
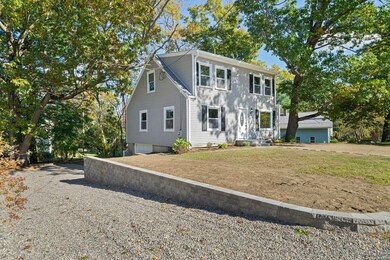
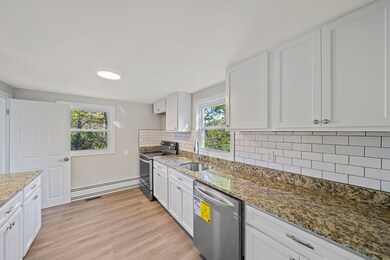
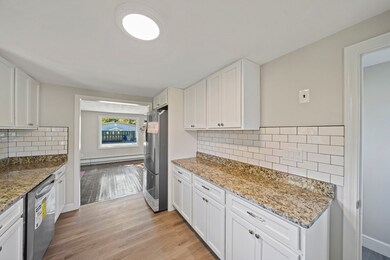
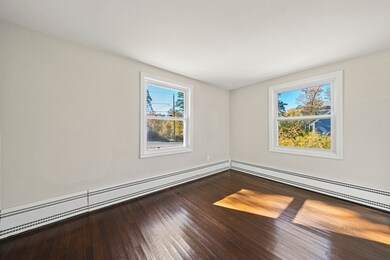
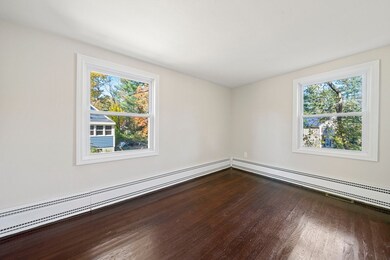
About This Home
As of January 2022Move right into this fully renovated Cape style home! From the moment you pull up this home has the perfect curb appeal! This home features newly finished hardwood floors, a brand new kitchen with granite countertops and stainless steel appliances, new vinyl windows, new siding, roofing, professional landscaping, a full 2nd floor shed dormer with brand new 2nd floor bathroom and laundry room, new central air conditioning, new lighting and freshly painted. Short distance to the center of town and easy access to the commuter rail! Don't miss this one!
Home Details
Home Type
- Single Family
Est. Annual Taxes
- $5,399
Year Built
- 1950
Parking
- 1
Flooring
- Wood Flooring
Utilities
- 2 Cooling Zones
- 2 Heating Zones
Ownership History
Date
Name
Owned For
Owner Type
Purchase Details
Listed on
Nov 5, 2021
Closed on
Jan 28, 2022
Sold by
Chimera Hldg & Invs Llc
Bought by
Navejas Angelina I
Seller's Agent
Michael Wagner
Donahue Real Estate Co.
Buyer's Agent
MB Associates
Coldwell Banker Realty - Newton
List Price
$569,900
Sold Price
$535,000
Premium/Discount to List
-$34,900
-6.12%
Current Estimated Value
Home Financials for this Owner
Home Financials are based on the most recent Mortgage that was taken out on this home.
Estimated Appreciation
$70,375
Avg. Annual Appreciation
3.02%
Original Mortgage
$492,200
Outstanding Balance
$459,712
Interest Rate
3.22%
Mortgage Type
Purchase Money Mortgage
Estimated Equity
$134,133
Purchase Details
Listed on
Feb 1, 2021
Closed on
Apr 16, 2021
Sold by
Gannon Jeanne D
Bought by
Chimera Hldg & Invs Llc
Seller's Agent
Paul Gannon
Law Offices of Paul J. Gannon
Buyer's Agent
Paul Gannon
Law Offices of Paul J. Gannon
List Price
$399,000
Sold Price
$310,000
Premium/Discount to List
-$89,000
-22.31%
Home Financials for this Owner
Home Financials are based on the most recent Mortgage that was taken out on this home.
Avg. Annual Appreciation
99.52%
Original Mortgage
$378,000
Interest Rate
3%
Mortgage Type
Commercial
Similar Homes in Randolph, MA
Create a Home Valuation Report for This Property
The Home Valuation Report is an in-depth analysis detailing your home's value as well as a comparison with similar homes in the area
Home Values in the Area
Average Home Value in this Area
Purchase History
| Date | Type | Sale Price | Title Company |
|---|---|---|---|
| Not Resolvable | $535,000 | None Available | |
| Not Resolvable | $310,000 | None Available |
Source: Public Records
Mortgage History
| Date | Status | Loan Amount | Loan Type |
|---|---|---|---|
| Open | $492,200 | Purchase Money Mortgage | |
| Previous Owner | $378,000 | Commercial |
Source: Public Records
Property History
| Date | Event | Price | Change | Sq Ft Price |
|---|---|---|---|---|
| 01/28/2022 01/28/22 | Sold | $535,000 | -6.1% | $217 / Sq Ft |
| 12/16/2021 12/16/21 | Pending | -- | -- | -- |
| 11/05/2021 11/05/21 | For Sale | $569,900 | +83.8% | $232 / Sq Ft |
| 04/16/2021 04/16/21 | Sold | $310,000 | -22.3% | $240 / Sq Ft |
| 03/10/2021 03/10/21 | Pending | -- | -- | -- |
| 02/01/2021 02/01/21 | For Sale | $399,000 | -- | $309 / Sq Ft |
Source: MLS Property Information Network (MLS PIN)
Tax History Compared to Growth
Tax History
| Year | Tax Paid | Tax Assessment Tax Assessment Total Assessment is a certain percentage of the fair market value that is determined by local assessors to be the total taxable value of land and additions on the property. | Land | Improvement |
|---|---|---|---|---|
| 2025 | $5,399 | $465,000 | $236,300 | $228,700 |
| 2024 | $5,222 | $456,100 | $231,700 | $224,400 |
| 2023 | $5,156 | $426,800 | $210,600 | $216,200 |
| 2022 | $4,852 | $356,800 | $175,400 | $181,400 |
| 2021 | $4,526 | $306,200 | $146,300 | $159,900 |
| 2020 | $4,431 | $297,200 | $146,300 | $150,900 |
| 2019 | $4,214 | $281,300 | $139,300 | $142,000 |
| 2018 | $4,061 | $255,700 | $129,100 | $126,600 |
| 2017 | $4,006 | $247,600 | $122,900 | $124,700 |
| 2016 | $3,855 | $221,700 | $111,700 | $110,000 |
| 2015 | $3,765 | $208,000 | $106,400 | $101,600 |
Source: Public Records
Agents Affiliated with this Home
-
Seller's Agent in 2022
Michael Wagner
Donahue Real Estate Co.
(781) 608-5123
1 in this area
56 Total Sales
-
Buyer's Agent in 2022
MB Associates
Coldwell Banker Realty - Newton
(617) 645-1360
1 in this area
131 Total Sales
-
P
Seller's Agent in 2021
Paul Gannon
Law Offices of Paul J. Gannon
(617) 269-1993
1 in this area
14 Total Sales
Map
Source: MLS Property Information Network (MLS PIN)
MLS Number: 72916867
APN: RAND-000051-H000000-017281
Disclaimer: Certain information contained herein is derived from information provided by parties other than Homes.com. All information provided is deemed reliable, but is not guaranteed to be accurate and should be independently verified.
![]() The property listing data and information, or the Images, set forth herein were provided to MLS Property Information Network, Inc. from third party sources, including sellers, lessors and public records, and were compiled by MLS Property Information Network, Inc. The property listing data and information, and the Images, are for the personal, non-commercial use of consumers having a good faith interest in purchasing or leasing listed properties of the type displayed to them and may not be used for any purpose other than to identify prospective properties which such consumers may have a good faith interest in purchasing or leasing. MLS Property Information Network, Inc. and its subscribers disclaim any and all representations and warranties as to the accuracy of the property listing data and information, or as to the accuracy of any of the Images, set forth herein.
The property listing data and information, or the Images, set forth herein were provided to MLS Property Information Network, Inc. from third party sources, including sellers, lessors and public records, and were compiled by MLS Property Information Network, Inc. The property listing data and information, and the Images, are for the personal, non-commercial use of consumers having a good faith interest in purchasing or leasing listed properties of the type displayed to them and may not be used for any purpose other than to identify prospective properties which such consumers may have a good faith interest in purchasing or leasing. MLS Property Information Network, Inc. and its subscribers disclaim any and all representations and warranties as to the accuracy of the property listing data and information, or as to the accuracy of any of the Images, set forth herein.
Nearby Homes