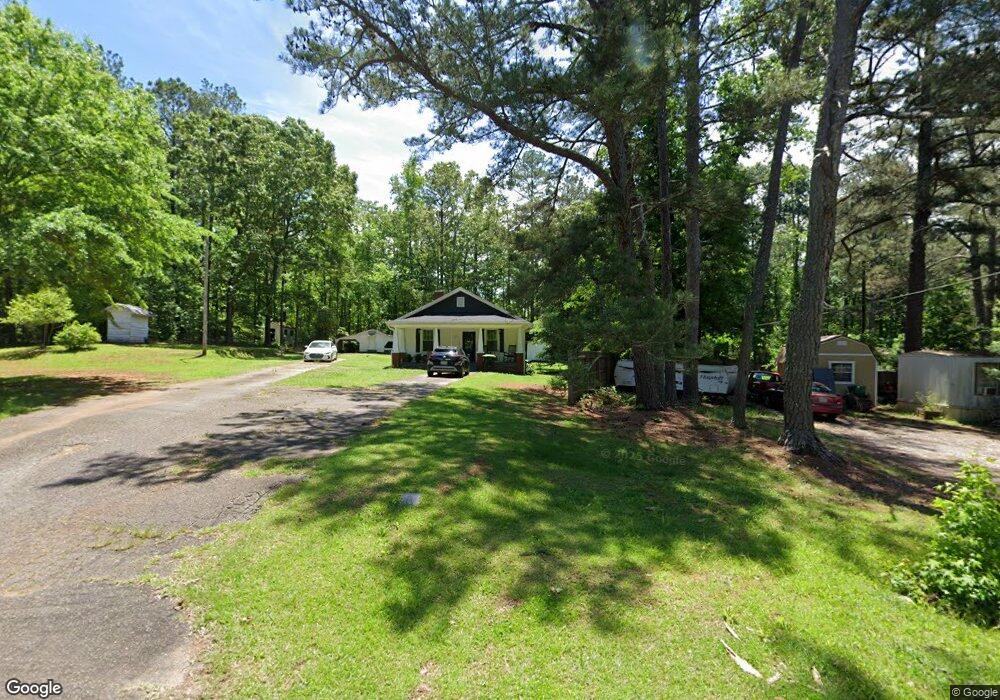
19 Witcher Cir Newnan, GA 30263
Estimated Value: $253,000 - $291,000
3
Beds
2
Baths
1,476
Sq Ft
$187/Sq Ft
Est. Value
About This Home
This home is located at 19 Witcher Cir, Newnan, GA 30263 and is currently estimated at $275,775, approximately $186 per square foot. 19 Witcher Cir is a home located in Coweta County with nearby schools including Northside Elementary School, Evans Middle School, and Newnan High School.
Ownership History
Date
Name
Owned For
Owner Type
Purchase Details
Closed on
May 21, 2021
Sold by
Horsley Roy H
Bought by
Cooke Glenn Harrison
Current Estimated Value
Home Financials for this Owner
Home Financials are based on the most recent Mortgage that was taken out on this home.
Original Mortgage
$216,997
Outstanding Balance
$196,235
Interest Rate
3.1%
Mortgage Type
FHA
Estimated Equity
$79,540
Purchase Details
Closed on
Aug 14, 2020
Sold by
Harper Elaine M
Bought by
Horsley Roy H and Stone Randy
Purchase Details
Closed on
Dec 19, 2017
Sold by
J Veitch Construction Inc
Bought by
Harper Elaine M and Dingler Hazel M
Purchase Details
Closed on
Sep 16, 2010
Sold by
Harper Elaine M
Bought by
Harper Johnny W and Harper Elaine M
Purchase Details
Closed on
Jun 20, 2010
Sold by
Morris Annie Mae
Bought by
Dingler Hazel and Dingler Elaine Harper
Purchase Details
Closed on
Feb 25, 2005
Sold by
Morris Annie M
Bought by
Harper Elaine M
Purchase Details
Closed on
Sep 30, 2003
Sold by
Morris Lonnie
Bought by
Morris Annie Mae
Create a Home Valuation Report for This Property
The Home Valuation Report is an in-depth analysis detailing your home's value as well as a comparison with similar homes in the area
Home Values in the Area
Average Home Value in this Area
Purchase History
| Date | Buyer | Sale Price | Title Company |
|---|---|---|---|
| Cooke Glenn Harrison | $221,000 | -- | |
| Horsley Roy H | $35,000 | -- | |
| Harper Elaine M | -- | -- | |
| Harper Johnny W | -- | -- | |
| Harper Elaine M | -- | -- | |
| Dingler Hazel A | -- | -- | |
| Dingler Hazel | -- | -- | |
| Harper Elaine M | -- | -- | |
| Morris Annie Mae | -- | -- |
Source: Public Records
Mortgage History
| Date | Status | Borrower | Loan Amount |
|---|---|---|---|
| Open | Cooke Glenn Harrison | $216,997 |
Source: Public Records
Tax History Compared to Growth
Tax History
| Year | Tax Paid | Tax Assessment Tax Assessment Total Assessment is a certain percentage of the fair market value that is determined by local assessors to be the total taxable value of land and additions on the property. | Land | Improvement |
|---|---|---|---|---|
| 2025 | $1,654 | $75,991 | $11,828 | $64,163 |
| 2024 | $1,582 | $72,757 | $11,828 | $60,929 |
| 2023 | $1,582 | $69,518 | $11,922 | $57,596 |
| 2022 | $1,252 | $55,527 | $9,171 | $46,356 |
| 2021 | $369 | $14,000 | $4,993 | $9,007 |
| 2020 | $649 | $24,489 | $8,734 | $15,755 |
| 2019 | $999 | $34,124 | $12,672 | $21,452 |
| 2018 | $1,001 | $34,124 | $12,672 | $21,452 |
| 2017 | $993 | $33,886 | $12,434 | $21,452 |
| 2016 | $981 | $33,886 | $12,434 | $21,452 |
| 2015 | $965 | $33,886 | $12,434 | $21,452 |
| 2014 | $957 | $33,886 | $12,434 | $21,452 |
Source: Public Records
Map
Nearby Homes
- 1242 Witcher Rd
- 0 & 1206 Macedonia Rd
- 12 Ulas B Ware Rd
- 279 Doc Perry Rd
- 1206 Macedonia Rd
- 1206 + 0 Macedonia Rd
- 11 Hubbard Rd
- 0 Witcher Rd Unit 14.23+/- AC 10524234
- 13 Tea House Ln Unit 13
- 21 Tea House Ln Unit 21
- 16 Tea House Ln Unit 16
- 62 Dawn St
- 0 Macedonia Rd Unit 10587744
- LOT 29 Mossy Oak Ct Unit 29
- 66 Belle Hall Dr Unit 2
- 50 Emerald Hills Ln
- 50 O'Tara Woods Dr
- 5 Gibson Rd
- 60 New St
- 21 Old Carrollton Rd
- 1245 Witcher Rd
- 49 Witcher Cir
- 32 Witcher Cir
- 32 Witcher Cir
- 1215 Witcher Rd Unit 3
- 1277 Witcher Rd
- 0 Witcher Cir
- 74 Witcher Cir
- 0 Hickory Hollow Unit LOT 1
- 0 Hickory Hollow Unit LOT 17 7014527
- 0 Hickory Hollow Unit DR
- 0 Hickory Hollow Unit LOT 17
- 0 Hickory Hollow Unit DR 07488928
- 0 Hickory Hollow Unit DR 07488899
- 1203 Witcher Rd Unit 4
- 1203 Witcher Rd
- 1301 Witcher Rd
- 1280 Witcher Rd
- 17 Hickory Hollow
- 1169 Witcher Rd Unit 2