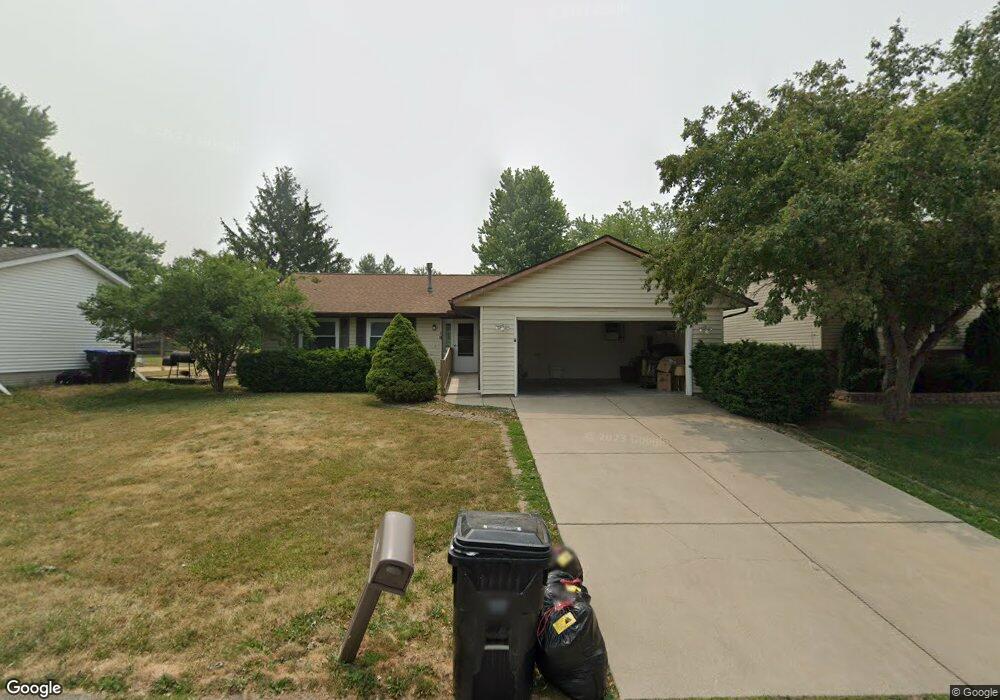
19 Yew Ct Bloomington, IL 61701
Oakwoods NeighborhoodEstimated Value: $225,000 - $254,000
3
Beds
2
Baths
1,300
Sq Ft
$180/Sq Ft
Est. Value
About This Home
This home is located at 19 Yew Ct, Bloomington, IL 61701 and is currently estimated at $233,875, approximately $179 per square foot. 19 Yew Ct is a home located in McLean County with nearby schools including Pepper Ridge Elementary School, Evans Junior High School, and Normal Community West High School.
Ownership History
Date
Name
Owned For
Owner Type
Purchase Details
Closed on
Jan 27, 2017
Sold by
Braue John W
Bought by
Braue John W
Current Estimated Value
Home Financials for this Owner
Home Financials are based on the most recent Mortgage that was taken out on this home.
Original Mortgage
$92,287
Outstanding Balance
$76,173
Interest Rate
4.09%
Estimated Equity
$157,702
Purchase Details
Closed on
Sep 24, 2007
Sold by
Underhill Jeffrey E and Underhill Renee L
Bought by
Braue John W
Home Financials for this Owner
Home Financials are based on the most recent Mortgage that was taken out on this home.
Original Mortgage
$107,000
Interest Rate
6.49%
Purchase Details
Closed on
Feb 5, 2007
Sold by
Underhill Jeffrey E
Bought by
Underhill Jeffrey E and Underhill Renee L
Home Financials for this Owner
Home Financials are based on the most recent Mortgage that was taken out on this home.
Original Mortgage
$114,600
Interest Rate
6.28%
Create a Home Valuation Report for This Property
The Home Valuation Report is an in-depth analysis detailing your home's value as well as a comparison with similar homes in the area
Home Values in the Area
Average Home Value in this Area
Purchase History
| Date | Buyer | Sale Price | Title Company |
|---|---|---|---|
| Braue John W | -- | None Available | |
| Braue John W | $134,000 | None Available | |
| Underhill Jeffrey E | -- | None Available |
Source: Public Records
Mortgage History
| Date | Status | Borrower | Loan Amount |
|---|---|---|---|
| Open | Braue John W | $92,287 | |
| Previous Owner | Braue John W | $107,000 | |
| Previous Owner | Underhill Jeffrey E | $114,600 |
Source: Public Records
Tax History
| Year | Tax Paid | Tax Assessment Tax Assessment Total Assessment is a certain percentage of the fair market value that is determined by local assessors to be the total taxable value of land and additions on the property. | Land | Improvement |
|---|---|---|---|---|
| 2024 | $3,774 | $58,769 | $12,466 | $46,303 |
| 2022 | $3,774 | $48,707 | $10,332 | $38,375 |
| 2021 | $3,450 | $44,588 | $9,458 | $35,130 |
| 2020 | $3,380 | $43,757 | $9,282 | $34,475 |
| 2019 | $3,270 | $43,757 | $9,282 | $34,475 |
| 2018 | $3,267 | $43,757 | $9,282 | $34,475 |
| 2017 | $3,135 | $43,757 | $9,282 | $34,475 |
| 2016 | $3,126 | $43,757 | $9,282 | $34,475 |
| 2015 | $3,133 | $43,836 | $9,299 | $34,537 |
| 2014 | $3,098 | $43,836 | $9,299 | $34,537 |
| 2013 | -- | $42,559 | $9,028 | $33,531 |
Source: Public Records
Map
Nearby Homes
- 1515 Six Points Rd
- 1513 6 Points Rd
- 26 Troy Ct
- 1020 Laesch Ave Unit A
- 6 Leo Dr
- 1 Christine Way
- 2709 and 2711 Fox Trot Trail
- 2705 and 2707 Fox Trot Trail
- 2511 Grey Fox Trail
- 2215 Savanna Rd
- 1409 Butchers Ln
- 2511 Savanna Rd
- 801 Wartburg Dr
- 2503 Treeline Dr
- 2513 Pampas Ln
- 2007 Fallen Oak Rd
- 2905 Binghamton Ln
- 1 Saint Ivans Cir
- 3 Saint Ivans Cir
- 2614 Handel
Your Personal Tour Guide
Ask me questions while you tour the home.