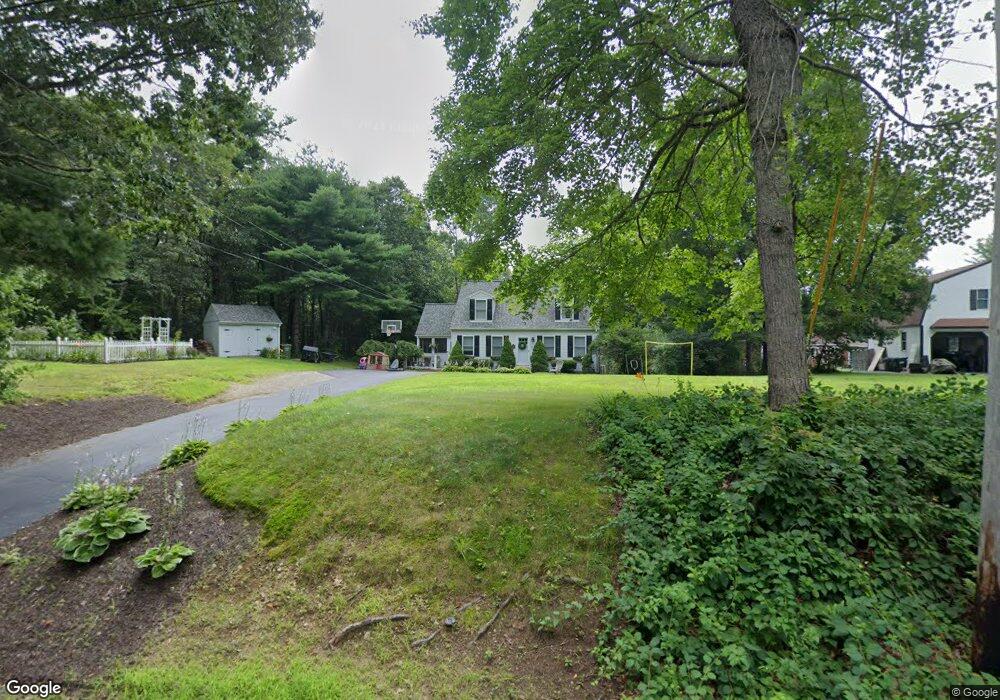
19 Yew St Douglas, MA 01516
Estimated Value: $477,000 - $608,000
3
Beds
2
Baths
1,428
Sq Ft
$368/Sq Ft
Est. Value
About This Home
This home is located at 19 Yew St, Douglas, MA 01516 and is currently estimated at $525,029, approximately $367 per square foot. 19 Yew St is a home located in Worcester County with nearby schools including Douglas Primary School, Douglas Middle School, and Douglas High School.
Ownership History
Date
Name
Owned For
Owner Type
Purchase Details
Closed on
Oct 22, 2008
Sold by
Toland Edward J
Bought by
Halter Jennifer T and Halter Jesse D
Current Estimated Value
Home Financials for this Owner
Home Financials are based on the most recent Mortgage that was taken out on this home.
Original Mortgage
$237,650
Outstanding Balance
$154,267
Interest Rate
5.94%
Mortgage Type
Purchase Money Mortgage
Estimated Equity
$370,762
Purchase Details
Closed on
Oct 23, 1996
Sold by
Votta Betty C
Bought by
Toland Edward and Toland Joanne
Home Financials for this Owner
Home Financials are based on the most recent Mortgage that was taken out on this home.
Original Mortgage
$112,950
Interest Rate
8.22%
Mortgage Type
Purchase Money Mortgage
Purchase Details
Closed on
Jul 20, 1995
Sold by
Ciesla Michael and Ciesla Vincent
Bought by
Votta Timothy and Votta James
Create a Home Valuation Report for This Property
The Home Valuation Report is an in-depth analysis detailing your home's value as well as a comparison with similar homes in the area
Home Values in the Area
Average Home Value in this Area
Purchase History
| Date | Buyer | Sale Price | Title Company |
|---|---|---|---|
| Halter Jennifer T | $245,000 | -- | |
| Toland Edward | $125,500 | -- | |
| Votta Timothy | $35,000 | -- |
Source: Public Records
Mortgage History
| Date | Status | Borrower | Loan Amount |
|---|---|---|---|
| Open | Halter Jennifer T | $237,650 | |
| Previous Owner | Votta Timothy | $157,100 | |
| Previous Owner | Votta Timothy | $25,000 | |
| Previous Owner | Votta Timothy | $127,200 | |
| Previous Owner | Votta Timothy | $112,950 |
Source: Public Records
Tax History
| Year | Tax Paid | Tax Assessment Tax Assessment Total Assessment is a certain percentage of the fair market value that is determined by local assessors to be the total taxable value of land and additions on the property. | Land | Improvement |
|---|---|---|---|---|
| 2025 | $52 | $396,100 | $99,400 | $296,700 |
| 2024 | $5,129 | $379,400 | $90,400 | $289,000 |
| 2023 | $5,032 | $350,400 | $90,400 | $260,000 |
| 2022 | $5,111 | $312,800 | $83,600 | $229,200 |
| 2021 | $4,143 | $295,200 | $79,600 | $215,600 |
| 2020 | $4,827 | $284,300 | $79,600 | $204,700 |
| 2019 | $4,676 | $267,200 | $79,600 | $187,600 |
| 2018 | $4,185 | $260,400 | $79,600 | $180,800 |
| 2017 | $3,451 | $244,400 | $82,800 | $161,600 |
| 2016 | $3,983 | $236,800 | $82,800 | $154,000 |
| 2015 | $3,898 | $236,800 | $82,800 | $154,000 |
Source: Public Records
Map
Nearby Homes
Your Personal Tour Guide
Ask me questions while you tour the home.