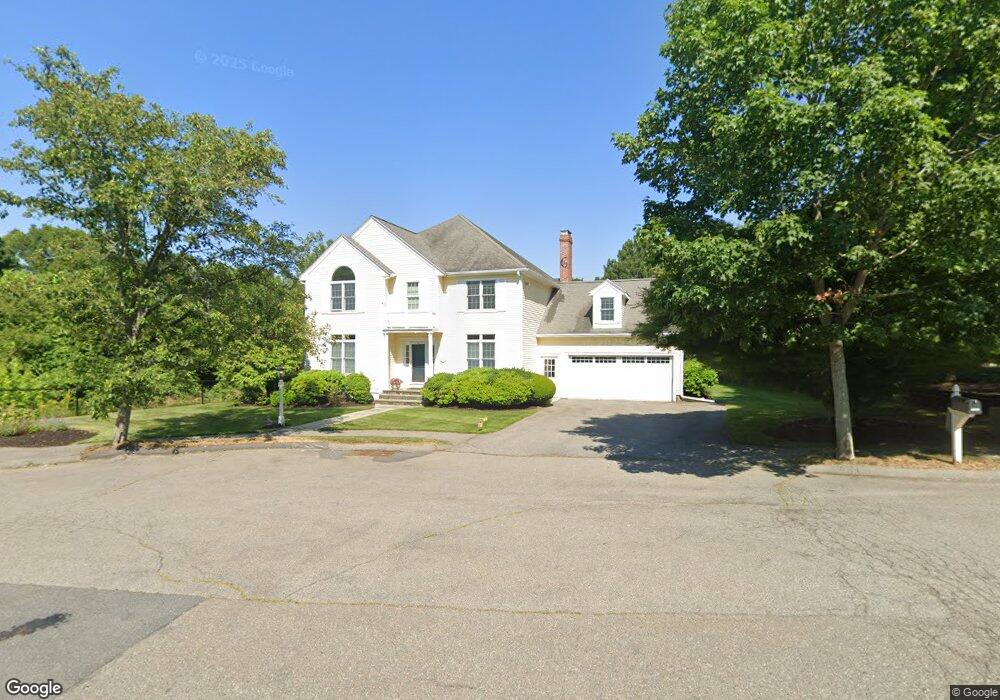
19 Yorkshire Rd Marblehead, MA 01945
Estimated Value: $1,263,000 - $1,497,000
5
Beds
3
Baths
3,367
Sq Ft
$406/Sq Ft
Est. Value
About This Home
This home is located at 19 Yorkshire Rd, Marblehead, MA 01945 and is currently estimated at $1,367,388, approximately $406 per square foot. 19 Yorkshire Rd is a home located in Essex County with nearby schools including Marblehead High School, Devereux School, and Tower School.
Ownership History
Date
Name
Owned For
Owner Type
Purchase Details
Closed on
Jan 13, 2020
Sold by
Granese Steven A
Bought by
Steven A Granese T
Current Estimated Value
Purchase Details
Closed on
Jun 29, 2016
Sold by
Granese Steven A and Granese Barbara J
Bought by
Granese Steven A
Purchase Details
Closed on
May 16, 1994
Sold by
Granese Rt and Granese Johna
Bought by
Granese Steven A and Granese Barbara
Create a Home Valuation Report for This Property
The Home Valuation Report is an in-depth analysis detailing your home's value as well as a comparison with similar homes in the area
Home Values in the Area
Average Home Value in this Area
Purchase History
| Date | Buyer | Sale Price | Title Company |
|---|---|---|---|
| Steven A Granese T | -- | None Available | |
| Granese Steven A | -- | -- | |
| Granese Steven A | $50,000 | -- |
Source: Public Records
Mortgage History
| Date | Status | Borrower | Loan Amount |
|---|---|---|---|
| Previous Owner | Granese Steven A | $208,000 | |
| Previous Owner | Granese Steven A | $209,000 |
Source: Public Records
Tax History
| Year | Tax Paid | Tax Assessment Tax Assessment Total Assessment is a certain percentage of the fair market value that is determined by local assessors to be the total taxable value of land and additions on the property. | Land | Improvement |
|---|---|---|---|---|
| 2025 | $11,163 | $1,233,500 | $559,700 | $673,800 |
| 2024 | $11,080 | $1,236,600 | $587,600 | $649,000 |
| 2023 | $11,702 | $1,170,200 | $657,600 | $512,600 |
| 2022 | $10,708 | $1,017,900 | $517,700 | $500,200 |
| 2021 | $10,228 | $981,600 | $489,700 | $491,900 |
| 2020 | $10,051 | $967,400 | $489,700 | $477,700 |
| 2019 | $9,564 | $890,500 | $433,700 | $456,800 |
| 2018 | $9,505 | $862,500 | $405,700 | $456,800 |
| 2017 | $9,189 | $834,600 | $377,800 | $456,800 |
| 2016 | $8,963 | $807,500 | $350,700 | $456,800 |
| 2015 | $8,968 | $809,400 | $350,700 | $458,700 |
| 2014 | $8,320 | $750,200 | $336,600 | $413,600 |
Source: Public Records
Map
Nearby Homes
- 11 Angenica Terrace
- 212 Humphrey St Unit 205
- 12 Pickwick Rd
- 16 Pickwick Rd
- 469 Loring Ave
- 4 Dean Rd
- 11 Elbridge Ln Unit 11
- 33 W Shore Dr
- 34 Lafayette St
- 28 Surrey Rd
- 4 Fairview Rd
- 3 Stillwell Dr Unit 10B
- 8 Russell Dr Unit 7D
- 23 Marion Rd Unit B
- 1008 Paradise Rd Unit 1M
- 106 Broadway Unit 3
- 1002 Paradise Rd Unit PHE
- 1004 Paradise Rd Unit 1K
- 1004 Paradise Rd Unit 1L
- 326 Lafayette St Unit 2
- 6 Riverside Dr
- 8 Riverside Dr
- 18 Yorkshire Rd
- 4 Riverside Dr
- 10 Riverside Dr
- 5 Riverside Dr
- 67 Leggs Hill Rd
- 2 Riverside Dr
- 3 Riverside Dr
- 7 Riverside Dr
- 11 Yorkshire Rd
- 9 Riverside Dr
- 66 Leggs Hill Rd
- 63 Leggs Hill Rd
- 11 Riverside Dr
- 12 Yorkshire Rd
- 68 Leggs Hill Rd
- 19 Fieldbrook Rd
- 9 Yorkshire Rd
- 17 Fieldbrook Rd
Your Personal Tour Guide
Ask me questions while you tour the home.