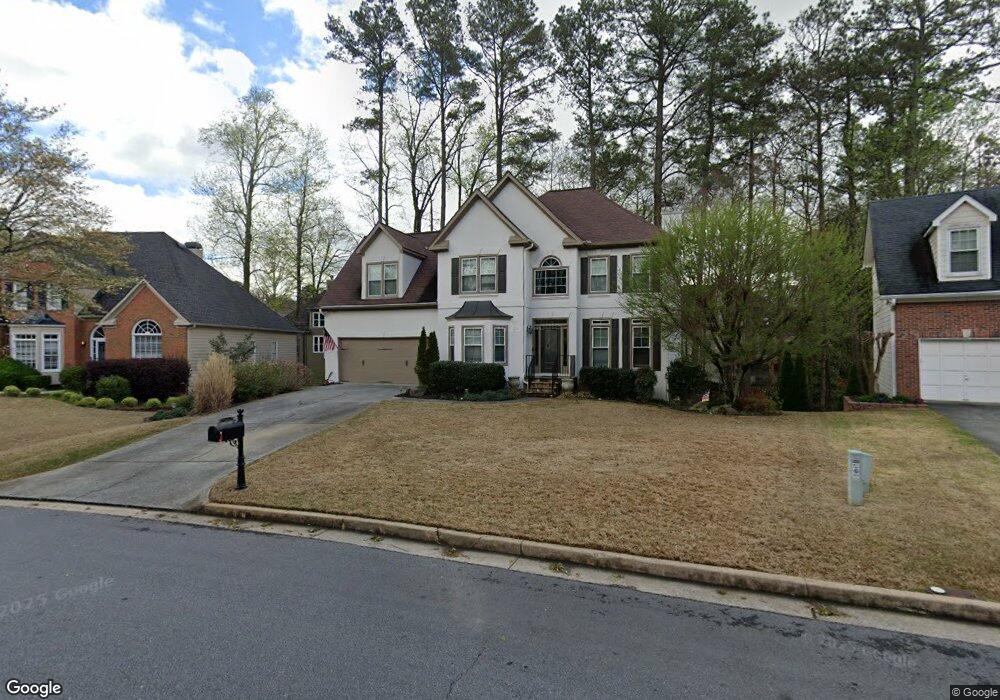
190 Brookhollow Trace Unit 1 Alpharetta, GA 30022
Estimated Value: $671,980 - $724,000
4
Beds
3
Baths
2,528
Sq Ft
$278/Sq Ft
Est. Value
About This Home
This home is located at 190 Brookhollow Trace Unit 1, Alpharetta, GA 30022 and is currently estimated at $702,745, approximately $277 per square foot. 190 Brookhollow Trace Unit 1 is a home located in Fulton County with nearby schools including Ocee Elementary School, Taylor Road Middle School, and Chattahoochee High School.
Ownership History
Date
Name
Owned For
Owner Type
Purchase Details
Closed on
May 27, 1999
Sold by
Spaid Timothy
Bought by
Spaid Timothy and Spaid Elizabeth L
Current Estimated Value
Home Financials for this Owner
Home Financials are based on the most recent Mortgage that was taken out on this home.
Original Mortgage
$164,000
Interest Rate
6.94%
Mortgage Type
Stand Alone Refi Refinance Of Original Loan
Purchase Details
Closed on
Sep 12, 1994
Sold by
Thomas Homes Inc
Bought by
Spaid Timothy A Elizabet
Home Financials for this Owner
Home Financials are based on the most recent Mortgage that was taken out on this home.
Original Mortgage
$171,800
Interest Rate
8.37%
Create a Home Valuation Report for This Property
The Home Valuation Report is an in-depth analysis detailing your home's value as well as a comparison with similar homes in the area
Home Values in the Area
Average Home Value in this Area
Purchase History
| Date | Buyer | Sale Price | Title Company |
|---|---|---|---|
| Spaid Timothy | -- | -- | |
| Spaid Timothy A Elizabet | $190,000 | -- |
Source: Public Records
Mortgage History
| Date | Status | Borrower | Loan Amount |
|---|---|---|---|
| Previous Owner | Spaid Timothy | $164,000 | |
| Previous Owner | Spaid Timothy A Elizabet | $171,800 |
Source: Public Records
Tax History Compared to Growth
Tax History
| Year | Tax Paid | Tax Assessment Tax Assessment Total Assessment is a certain percentage of the fair market value that is determined by local assessors to be the total taxable value of land and additions on the property. | Land | Improvement |
|---|---|---|---|---|
| 2025 | $3,836 | $268,840 | $68,480 | $200,360 |
| 2023 | $6,568 | $232,680 | $45,160 | $187,520 |
| 2022 | $3,680 | $197,120 | $40,400 | $156,720 |
| 2021 | $3,622 | $141,440 | $24,160 | $117,280 |
| 2020 | $3,443 | $141,440 | $24,160 | $117,280 |
| 2019 | $411 | $141,440 | $24,160 | $117,280 |
| 2018 | $3,892 | $140,600 | $39,360 | $101,240 |
| 2017 | $3,378 | $111,960 | $17,360 | $94,600 |
| 2016 | $3,294 | $111,400 | $17,360 | $94,040 |
| 2015 | $3,312 | $110,720 | $17,360 | $93,360 |
| 2014 | $3,401 | $110,720 | $17,360 | $93,360 |
Source: Public Records
Map
Nearby Homes
- 134 Wards Crossing Way Unit 17
- 11390 Ridge Hill Dr
- 11085 State Bridge Rd
- 4740 Carversham Way
- 11125 Pinehigh Dr
- 4790 Roswell Mill Dr
- 4015 Breckenridge Ct
- 4645 Valais Ct Unit 109
- 517 Boardwalk Way
- 515 Boardwalk Way
- 4305 Pine Vista Blvd
- 130 Douglas Fir Ct Unit 1
- 635 Park Creek Trace
- 4845 Weathervane Dr
- 690 Kimball Parc Way
- 2060 Park Glenn Dr
- 680 Kimball Parc Way
- 4905 Weathervane Dr
- 3965 Brookline Dr
- 485 Portrait Cir
- 180 Brookhollow Trace
- 200 Brookhollow Trace
- 515 Willowbrook Run Unit 2
- 505 Willowbrook Run
- 210 Brookhollow Trace
- 525 Willowbrook Run
- 170 Brookhollow Trace Unit 1
- 205 Brookhollow Trace
- 495 Willowbrook Run
- 215 Brookhollow Trace
- 160 Brookhollow Trace Unit 1
- 11270 Brookhollow Trail Unit 2
- 510 Willowbrook Run
- 185 Brookhollow Trace
- 500 Willowbrook Run
- 220 Brookhollow Trace Unit 1
- 220 Brookhollow Trace
- 11280 Brookhollow Trail
- 150 Brookhollow Trace Unit 1
- 520 Willowbrook Run