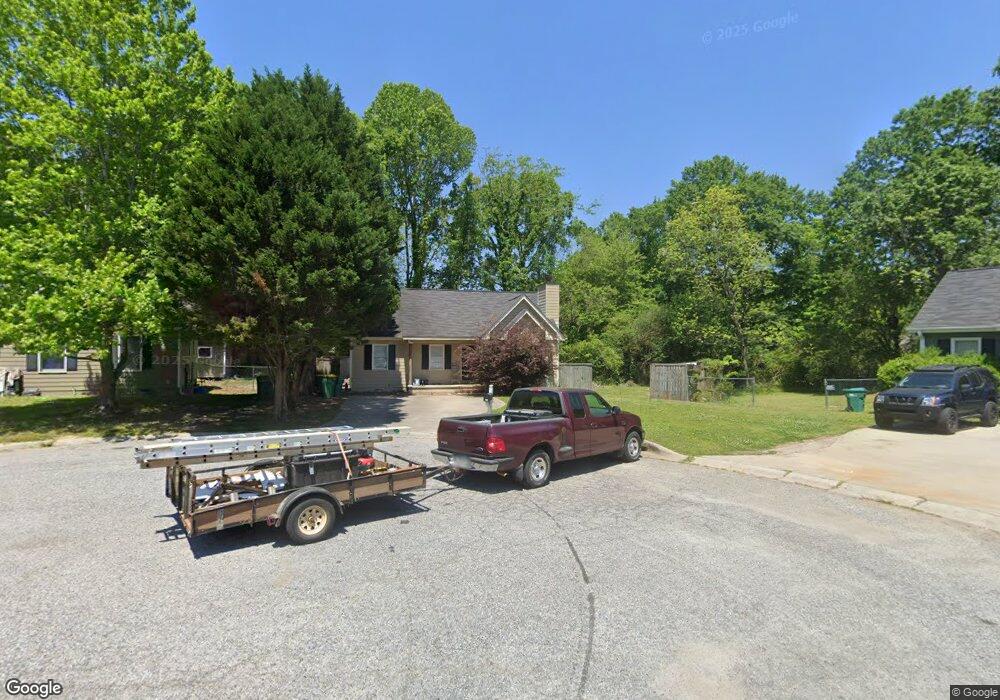
190 Charles Ct Winder, GA 30680
Estimated Value: $227,116 - $275,000
--
Bed
2
Baths
1,073
Sq Ft
$229/Sq Ft
Est. Value
About This Home
This home is located at 190 Charles Ct, Winder, GA 30680 and is currently estimated at $245,779, approximately $229 per square foot. 190 Charles Ct is a home located in Barrow County with nearby schools including County Line Elementary School, Russell Middle School, and Winder-Barrow High School.
Ownership History
Date
Name
Owned For
Owner Type
Purchase Details
Closed on
Jan 5, 2021
Sold by
Sap Properties Llc
Bought by
Matias Maria Francisco and Matias Ricardo Francisco
Current Estimated Value
Home Financials for this Owner
Home Financials are based on the most recent Mortgage that was taken out on this home.
Original Mortgage
$127,500
Outstanding Balance
$44,122
Interest Rate
2.71%
Mortgage Type
New Conventional
Estimated Equity
$201,657
Purchase Details
Closed on
Aug 4, 2000
Sold by
Reed Mary M
Bought by
Page Phillip A and Page Phillip
Home Financials for this Owner
Home Financials are based on the most recent Mortgage that was taken out on this home.
Original Mortgage
$77,500
Interest Rate
8.12%
Mortgage Type
New Conventional
Purchase Details
Closed on
Oct 31, 1997
Sold by
Reproductions Harwell
Bought by
Reed Mary M
Home Financials for this Owner
Home Financials are based on the most recent Mortgage that was taken out on this home.
Original Mortgage
$67,800
Interest Rate
7.39%
Mortgage Type
New Conventional
Create a Home Valuation Report for This Property
The Home Valuation Report is an in-depth analysis detailing your home's value as well as a comparison with similar homes in the area
Home Values in the Area
Average Home Value in this Area
Purchase History
| Date | Buyer | Sale Price | Title Company |
|---|---|---|---|
| Matias Maria Francisco | $147,500 | -- | |
| Page Phillip A | $77,500 | -- | |
| Reed Mary M | $69,900 | -- |
Source: Public Records
Mortgage History
| Date | Status | Borrower | Loan Amount |
|---|---|---|---|
| Open | Matias Maria Francisco | $127,500 | |
| Previous Owner | Page Phillip A | $77,500 | |
| Previous Owner | Reed Mary M | $67,800 |
Source: Public Records
Tax History Compared to Growth
Tax History
| Year | Tax Paid | Tax Assessment Tax Assessment Total Assessment is a certain percentage of the fair market value that is determined by local assessors to be the total taxable value of land and additions on the property. | Land | Improvement |
|---|---|---|---|---|
| 2024 | $1,436 | $49,760 | $10,800 | $38,960 |
| 2023 | $1,432 | $49,760 | $10,800 | $38,960 |
| 2022 | $1,670 | $47,531 | $10,800 | $36,731 |
| 2021 | $1,770 | $47,531 | $10,800 | $36,731 |
| 2020 | $1,692 | $47,531 | $10,800 | $36,731 |
| 2019 | $1,642 | $45,317 | $10,800 | $34,517 |
| 2018 | $1,247 | $33,447 | $10,000 | $23,447 |
| 2017 | $794 | $26,626 | $8,000 | $18,626 |
| 2016 | $908 | $25,962 | $8,000 | $17,962 |
| 2015 | $923 | $26,390 | $8,000 | $18,390 |
| 2014 | $852 | $24,092 | $5,488 | $18,604 |
| 2013 | -- | $23,201 | $5,488 | $17,713 |
Source: Public Records
Map
Nearby Homes
- 17 W Wright St
- 0 Jerome St Unit 7439149
- 0 Jerome St Unit 10359679
- 311 2nd Ave
- 0 W Williams St Unit 10464682
- 18 E New St
- 15 E New St
- 116 N Broad St
- 131 Pinehurst Dr
- 253 3rd Ave
- 352 3rd Ave
- 102 N Center St
- 256 4th Ave
- 19 Holland Cove
- 25 Holland Cove
- 92 Woodlawn Ave
- 209 Georgia Ave
- 317 Georgia Ave
- 273 Nancy St
- 165 Shields St
- 192 Charles Ct
- 188 Charles Ct
- 186 Charles Ct
- 242 W Oak St
- 193 Charles Ct
- 238 W Oak St
- 184 Charles Ct
- 189 Charles Ct
- 191 Charles Ct
- 240 W Oak St
- 187 Charles Ct
- 182 Charles Ct
- 199 Woodlawn Ave
- 185 Charles Ct
- 236 W Oak St
- 203 Woodlawn Ave
- 0 Charles Ct Unit 8423159
- 232 W Oak St
- 45 W Wright St
- 183 Charles Ct