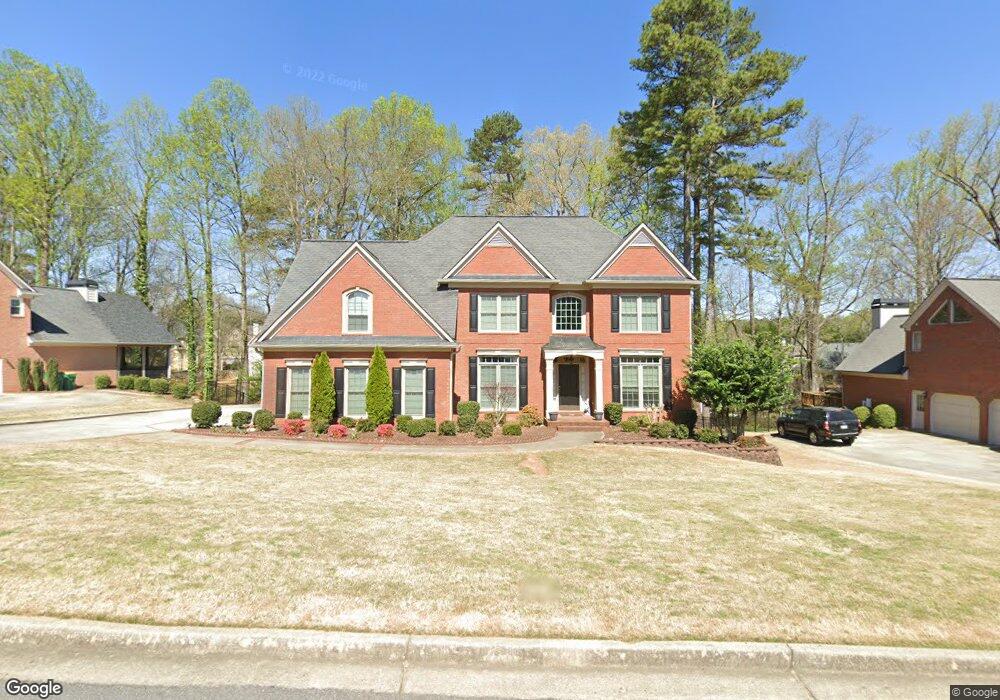
190 Colton Crest Dr Unit 2A Alpharetta, GA 30005
Seven Oaks NeighborhoodEstimated Value: $795,000 - $938,000
4
Beds
3
Baths
2,773
Sq Ft
$302/Sq Ft
Est. Value
About This Home
This home is located at 190 Colton Crest Dr Unit 2A, Alpharetta, GA 30005 and is currently estimated at $837,298, approximately $301 per square foot. 190 Colton Crest Dr Unit 2A is a home located in Fulton County with nearby schools including Taylor Road Middle School, Chattahoochee High School, and Valor Christian Academy.
Ownership History
Date
Name
Owned For
Owner Type
Purchase Details
Closed on
Sep 16, 2002
Sold by
Clark Stevenn G and Clark Nancy V
Bought by
Cocca Christopher J and Cocca Laura L
Current Estimated Value
Home Financials for this Owner
Home Financials are based on the most recent Mortgage that was taken out on this home.
Original Mortgage
$235,000
Outstanding Balance
$97,738
Interest Rate
6.18%
Mortgage Type
New Conventional
Estimated Equity
$739,560
Purchase Details
Closed on
Jun 26, 1997
Sold by
John Wieland Homes Inc
Bought by
Clark Steven G
Home Financials for this Owner
Home Financials are based on the most recent Mortgage that was taken out on this home.
Original Mortgage
$233,850
Interest Rate
2.75%
Mortgage Type
New Conventional
Create a Home Valuation Report for This Property
The Home Valuation Report is an in-depth analysis detailing your home's value as well as a comparison with similar homes in the area
Home Values in the Area
Average Home Value in this Area
Purchase History
| Date | Buyer | Sale Price | Title Company |
|---|---|---|---|
| Cocca Christopher J | $377,000 | -- | |
| Clark Steven G | $292,400 | -- |
Source: Public Records
Mortgage History
| Date | Status | Borrower | Loan Amount |
|---|---|---|---|
| Open | Cocca Christopher J | $235,000 | |
| Closed | Cocca Christopher J | $50,000 | |
| Previous Owner | Clark Steven G | $233,850 |
Source: Public Records
Tax History Compared to Growth
Tax History
| Year | Tax Paid | Tax Assessment Tax Assessment Total Assessment is a certain percentage of the fair market value that is determined by local assessors to be the total taxable value of land and additions on the property. | Land | Improvement |
|---|---|---|---|---|
| 2025 | $5,251 | $359,200 | $89,520 | $269,680 |
| 2023 | $5,251 | $299,320 | $90,600 | $208,720 |
| 2022 | $5,026 | $234,760 | $45,440 | $189,320 |
| 2021 | $4,970 | $187,760 | $47,360 | $140,400 |
| 2020 | $5,001 | $176,440 | $39,720 | $136,720 |
| 2019 | $600 | $173,320 | $39,040 | $134,280 |
| 2018 | $5,012 | $169,280 | $38,120 | $131,160 |
| 2017 | $4,961 | $158,760 | $35,600 | $123,160 |
| 2016 | $4,850 | $158,280 | $35,600 | $122,680 |
| 2015 | $4,901 | $158,280 | $35,600 | $122,680 |
| 2014 | $4,004 | $126,560 | $28,480 | $98,080 |
Source: Public Records
Map
Nearby Homes
- 7335 Lytham Trace
- 110 W Meadows Ct
- 595 Barsham Way
- 11915 Carriage Park Ln
- 11800 Carriage Park Ln
- 230 Sessingham Ln
- 7170 Collingsworth Place
- 7105 Brookwood Way
- 5785 Oxborough Way Unit 1
- 11705 Bentham Ct Unit 1
- 5735 Sunset Maple Dr
- 5650 Preserve Cir
- 11575 Windbrooke Way Unit 2
- 5575 Ashwind Trace
- 7530 Newstead Dr
- 11615 Windbrooke Way
- 200 Colton Crest Dr Unit 4A
- 180 Colton Crest Dr Unit 2A/14
- 180 Colton Crest Dr Unit 2A
- 535 Meadows Creek Dr
- 210 Colton Crest Dr Unit 4A
- 170 Colton Crest Dr
- 545 Meadows Creek Dr
- 5750 Culler Ct
- 525 Meadows Creek Dr
- 5755 Culler Ct
- 555 Meadows Creek Dr
- 185 Colton Crest Dr Unit IVA
- 145 Colton Crest Dr Unit 2A
- 160 Colton Crest Dr
- 220 Colton Crest Dr
- 5760 Culler Ct Unit B
- 515 Meadows Creek Dr
- 565 Meadows Creek Dr
- 5765 Culler Ct Unit IVB
- 0 Meadows Creek Dr Unit 8011742