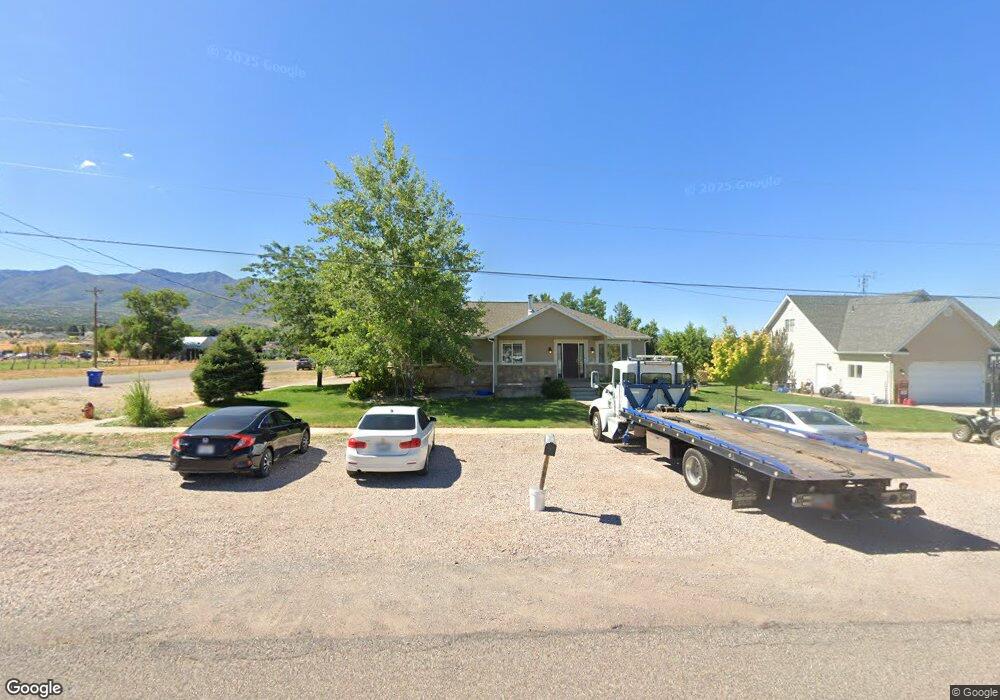
190 E 300 S Fillmore, UT 84631
Estimated Value: $411,000 - $453,000
Studio
--
Bath
--
Sq Ft
13,504
Sq Ft Lot
About This Home
This home is located at 190 E 300 S, Fillmore, UT 84631 and is currently estimated at $436,485. 190 E 300 S is a home.
Ownership History
Date
Name
Owned For
Owner Type
Purchase Details
Closed on
Jul 27, 2022
Sold by
Brown Andrew James and Brown Lori Christensen
Bought by
Brown Lori Christensen
Current Estimated Value
Home Financials for this Owner
Home Financials are based on the most recent Mortgage that was taken out on this home.
Original Mortgage
$295,000
Outstanding Balance
$281,895
Interest Rate
5.78%
Mortgage Type
New Conventional
Estimated Equity
$154,590
Purchase Details
Closed on
Jul 12, 2021
Sold by
Brown Andrew
Bought by
Brown Andrew James and Brown Lori Christopher
Home Financials for this Owner
Home Financials are based on the most recent Mortgage that was taken out on this home.
Original Mortgage
$288,750
Interest Rate
2.9%
Purchase Details
Closed on
Sep 24, 2009
Sold by
B & J Construction Inc
Bought by
Brown Andrew
Purchase Details
Closed on
Apr 1, 2008
Sold by
Abj Llc
Bought by
Beckstrand Richard O and Beckstrand Sheri Kay
Create a Home Valuation Report for This Property
The Home Valuation Report is an in-depth analysis detailing your home's value as well as a comparison with similar homes in the area
Home Values in the Area
Average Home Value in this Area
Purchase History
| Date | Buyer | Sale Price | Title Company |
|---|---|---|---|
| Brown Lori Christensen | -- | Apex Title | |
| Brown Andrew James | -- | Apex Title Ins Agency Co | |
| Brown Andrew | -- | -- | |
| Beckstrand Richard O | -- | -- |
Source: Public Records
Mortgage History
| Date | Status | Borrower | Loan Amount |
|---|---|---|---|
| Open | Brown Lori Christensen | $295,000 | |
| Previous Owner | Brown Andrew James | $288,750 |
Source: Public Records
Tax History
| Year | Tax Paid | Tax Assessment Tax Assessment Total Assessment is a certain percentage of the fair market value that is determined by local assessors to be the total taxable value of land and additions on the property. | Land | Improvement |
|---|---|---|---|---|
| 2025 | $2,111 | $265,085 | $22,696 | $242,389 |
| 2024 | $2,111 | $237,993 | $20,292 | $217,701 |
| 2023 | $2,536 | $237,993 | $20,292 | $217,701 |
| 2022 | $1,845 | $165,633 | $18,448 | $147,185 |
| 2021 | $1,643 | $141,642 | $11,979 | $129,663 |
| 2020 | $1,524 | $132,142 | $10,890 | $121,252 |
| 2019 | $1,286 | $111,861 | $10,890 | $100,971 |
| 2018 | $1,224 | $109,013 | $10,890 | $98,123 |
| 2017 | $1,132 | $95,781 | $10,890 | $84,891 |
| 2016 | $1,082 | $95,781 | $10,890 | $84,891 |
| 2015 | $1,083 | $95,781 | $10,890 | $84,891 |
| 2014 | -- | $95,781 | $10,890 | $84,891 |
| 2013 | -- | $95,781 | $10,890 | $84,891 |
Source: Public Records
Map
Nearby Homes
- 235 S 200 St E
- 157 E 500 South St
- 155 E 500 St S
- 430 E Canyon Rd
- 405 E 500 St S
- 40 S 100 Rd E
- 465 S 100 W
- 760 E 700 St S
- 155 W Center St
- 690 E 500 S
- 260 W 200 S
- 75 N 100 West St
- 351 W 100 South St
- 750 800 South Fillmore
- 825 800 South Fillmore
- 800 800 South Fillmore
- 775 E Valley View Rd
- 225 W 200 St N
- 310 S 500 West Rd
- 245 W 300 N
Your Personal Tour Guide
Ask me questions while you tour the home.