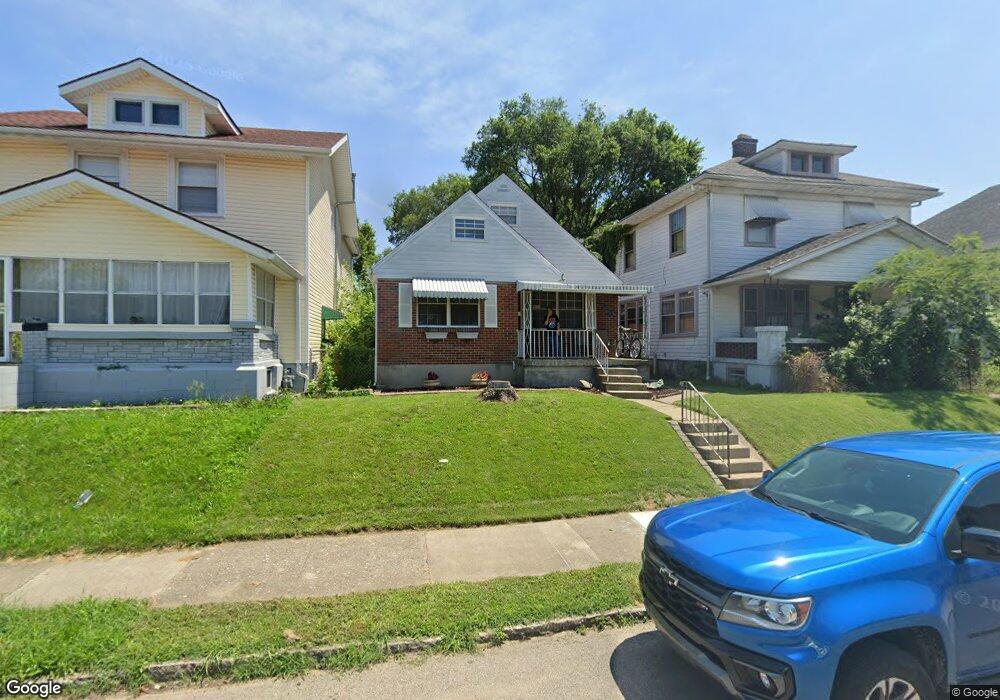
190 Grove Ave Dayton, OH 45404
Old North Dayton NeighborhoodEstimated Value: $79,000 - $149,000
2
Beds
1
Bath
1,206
Sq Ft
$90/Sq Ft
Est. Value
About This Home
This home is located at 190 Grove Ave, Dayton, OH 45404 and is currently estimated at $108,974, approximately $90 per square foot. 190 Grove Ave is a home located in Montgomery County with nearby schools including Kiser Elementary, Ruskin Elementary School, and Liberty High School.
Ownership History
Date
Name
Owned For
Owner Type
Purchase Details
Closed on
Mar 5, 2008
Sold by
Lay Lewis H
Bought by
Stacionis Steve
Current Estimated Value
Home Financials for this Owner
Home Financials are based on the most recent Mortgage that was taken out on this home.
Original Mortgage
$55,134
Outstanding Balance
$34,348
Interest Rate
5.74%
Mortgage Type
FHA
Estimated Equity
$74,626
Purchase Details
Closed on
Jan 28, 2005
Sold by
Lay Herstle L
Bought by
Lay Herstle L and Lay Mabel B
Purchase Details
Closed on
Jan 12, 1998
Sold by
Estate Of Lavada Bennett
Bought by
Lay Herstle and Bennett Earl P
Purchase Details
Closed on
Jan 8, 1998
Sold by
Bennett Earl P
Bought by
Lay Herstle
Purchase Details
Closed on
Nov 2, 1994
Sold by
Lay Herstle L and Lay Mabel B
Bought by
Bennett Lavada
Purchase Details
Closed on
Aug 5, 1994
Sold by
Harmuth Delta G and Roberts Delta Graye
Bought by
Lay Herstle L and Lay Mabel B
Create a Home Valuation Report for This Property
The Home Valuation Report is an in-depth analysis detailing your home's value as well as a comparison with similar homes in the area
Home Values in the Area
Average Home Value in this Area
Purchase History
| Date | Buyer | Sale Price | Title Company |
|---|---|---|---|
| Stacionis Steve | $56,000 | Attorney | |
| Lay Herstle L | -- | None Available | |
| Lay Herstle | -- | -- | |
| Lay Herstle | -- | -- | |
| Lay Herstle | -- | -- | |
| Bennett Lavada | -- | -- | |
| Lay Herstle L | -- | Landmark Title |
Source: Public Records
Mortgage History
| Date | Status | Borrower | Loan Amount |
|---|---|---|---|
| Open | Stacionis Steve | $55,134 |
Source: Public Records
Tax History Compared to Growth
Tax History
| Year | Tax Paid | Tax Assessment Tax Assessment Total Assessment is a certain percentage of the fair market value that is determined by local assessors to be the total taxable value of land and additions on the property. | Land | Improvement |
|---|---|---|---|---|
| 2024 | $1,048 | $18,090 | $2,560 | $15,530 |
| 2023 | $1,048 | $18,090 | $2,560 | $15,530 |
| 2022 | $1,149 | $15,400 | $2,180 | $13,220 |
| 2021 | $1,143 | $15,400 | $2,180 | $13,220 |
| 2020 | $1,141 | $15,400 | $2,180 | $13,220 |
| 2019 | $973 | $11,680 | $1,840 | $9,840 |
| 2018 | $974 | $11,680 | $1,840 | $9,840 |
| 2017 | $967 | $11,680 | $1,840 | $9,840 |
| 2016 | $946 | $10,850 | $1,750 | $9,100 |
| 2015 | $897 | $10,850 | $1,750 | $9,100 |
| 2014 | $897 | $10,850 | $1,750 | $9,100 |
| 2012 | -- | $15,550 | $4,030 | $11,520 |
Source: Public Records
Map
Nearby Homes
- 192 Grove Ave
- 184 Grove Ave
- 180 Grove Ave
- 198 Grove Ave
- 176 Grove Ave
- 174 Grove Ave
- 91 Notre Dame Ave
- 202 Grove Ave
- 87 Notre Dame Ave
- 95 Notre Dame Ave
- 83 Notre Dame Ave
- 97 Notre Dame Ave
- 168 Grove Ave
- 77 Notre Dame Ave
- 189 Grove Ave
- 193 Grove Ave
- 185 Grove Ave
- 204 Grove Ave
- 204 Grove Ave Unit ELM
- 1615 Warner Ave