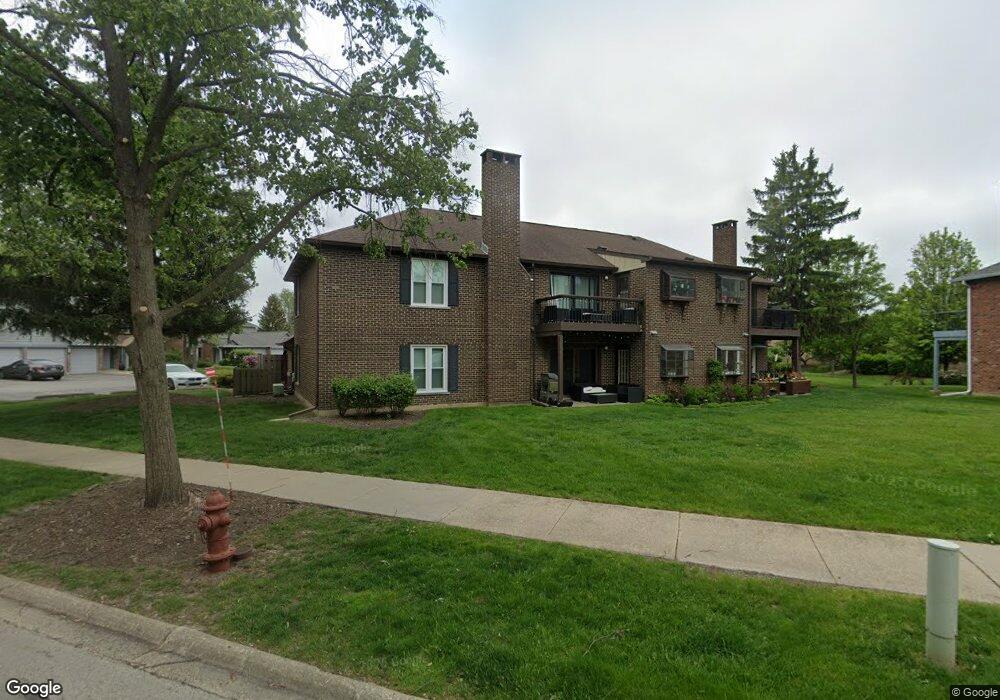
190 Grove Ave Unit 52C Des Plaines, IL 60016
Estimated Value: $253,521 - $294,000
2
Beds
--
Bath
7,080
Sq Ft
$38/Sq Ft
Est. Value
About This Home
This home is located at 190 Grove Ave Unit 52C, Des Plaines, IL 60016 and is currently estimated at $271,380, approximately $38 per square foot. 190 Grove Ave Unit 52C is a home located in Cook County with nearby schools including North Elementary School, Chippewa Middle School, and Maine West High School.
Ownership History
Date
Name
Owned For
Owner Type
Purchase Details
Closed on
Dec 31, 2007
Sold by
Tudor George
Bought by
Radoncic Dzelal B
Current Estimated Value
Home Financials for this Owner
Home Financials are based on the most recent Mortgage that was taken out on this home.
Original Mortgage
$155,040
Outstanding Balance
$97,045
Interest Rate
6%
Mortgage Type
Unknown
Estimated Equity
$174,335
Purchase Details
Closed on
Aug 30, 2005
Sold by
Isaacs Jeff
Bought by
Tudor George
Home Financials for this Owner
Home Financials are based on the most recent Mortgage that was taken out on this home.
Original Mortgage
$190,400
Interest Rate
7.89%
Mortgage Type
Unknown
Purchase Details
Closed on
Jan 3, 1997
Sold by
Fischer Arthur J and Fischer Diane M
Bought by
Isaacs Jeff
Home Financials for this Owner
Home Financials are based on the most recent Mortgage that was taken out on this home.
Original Mortgage
$30,000
Interest Rate
7.46%
Create a Home Valuation Report for This Property
The Home Valuation Report is an in-depth analysis detailing your home's value as well as a comparison with similar homes in the area
Home Values in the Area
Average Home Value in this Area
Purchase History
| Date | Buyer | Sale Price | Title Company |
|---|---|---|---|
| Radoncic Dzelal B | $194,000 | Cti | |
| Radoncic Dzelal B | $194,000 | Cti | |
| Tudor George | $238,000 | Rtc | |
| Tudor George | $238,000 | Rtc | |
| Isaacs Jeff | -- | Chicago Title Insurance Co |
Source: Public Records
Mortgage History
| Date | Status | Borrower | Loan Amount |
|---|---|---|---|
| Open | Radoncic Dzelal B | $155,040 | |
| Closed | Radoncic Dzelal B | $155,040 | |
| Previous Owner | Tudor George | $190,400 | |
| Previous Owner | Isaacs Jeff | $30,000 |
Source: Public Records
Tax History Compared to Growth
Tax History
| Year | Tax Paid | Tax Assessment Tax Assessment Total Assessment is a certain percentage of the fair market value that is determined by local assessors to be the total taxable value of land and additions on the property. | Land | Improvement |
|---|---|---|---|---|
| 2024 | $4,032 | $18,608 | $3,356 | $15,252 |
| 2023 | $3,908 | $18,608 | $3,356 | $15,252 |
| 2022 | $3,908 | $18,608 | $3,356 | $15,252 |
| 2021 | $2,720 | $12,179 | $4,075 | $8,104 |
| 2020 | $2,743 | $12,179 | $4,075 | $8,104 |
| 2019 | $2,753 | $13,660 | $4,075 | $9,585 |
| 2018 | $2,256 | $10,978 | $3,596 | $7,382 |
| 2017 | $2,234 | $10,978 | $3,596 | $7,382 |
| 2016 | $2,357 | $10,978 | $3,596 | $7,382 |
| 2015 | $2,337 | $10,354 | $3,116 | $7,238 |
| 2014 | $2,304 | $10,354 | $3,116 | $7,238 |
| 2013 | $2,229 | $10,354 | $3,116 | $7,238 |
Source: Public Records
Map
Nearby Homes
- 1578 Woodland Ave Unit D
- 1433 Willow Ave
- 430 Oak St
- 365 Graceland Ave Unit 205A
- 394 Alles St Unit 3B
- 395 Graceland Ave Unit 207
- 185 Eli Ct
- 184 Lilah Ct
- 182 Lilah Ct
- 182 Eli Ct
- 476 Alles St Unit 508
- 476 Alles St Unit 210
- 501 Alles St Unit 501A
- 555 S River Rd Unit 301
- 1470 Jefferson St Unit 504
- 1470 Jefferson St Unit 405
- 550 Ida St Unit 2NW
- 1279 Harding Ave Unit 3B
- 1279 Harding Ave Unit 2B
- 1389 Perry St Unit 303
- 190 Grove Ave Unit C
- 190 Grove Ave Unit 52D
- 190 Grove Ave Unit 51B
- 190 Grove Ave Unit 51A
- 190 Grove Ave Unit D
- 190 Grove Ave Unit A
- 190 Grove Ave Unit B
- 198 Grove Ave Unit 12D
- 198 Grove Ave Unit 11B
- 198 Grove Ave Unit 12C
- 198 Grove Ave Unit 11A
- 198 Grove Ave Unit 1A
- 188 Grove Ave Unit 62D
- 188 Grove Ave Unit 62C
- 188 Grove Ave Unit 61B
- 188 Grove Ave Unit 61A
- 188 Grove Ave Unit D
- 188 Grove Ave Unit C
- 192 Grove Ave Unit 41B
- 192 Grove Ave Unit 42C