Estimated Value: $874,501 - $990,000
3
Beds
2
Baths
1,800
Sq Ft
$524/Sq Ft
Est. Value
About This Home
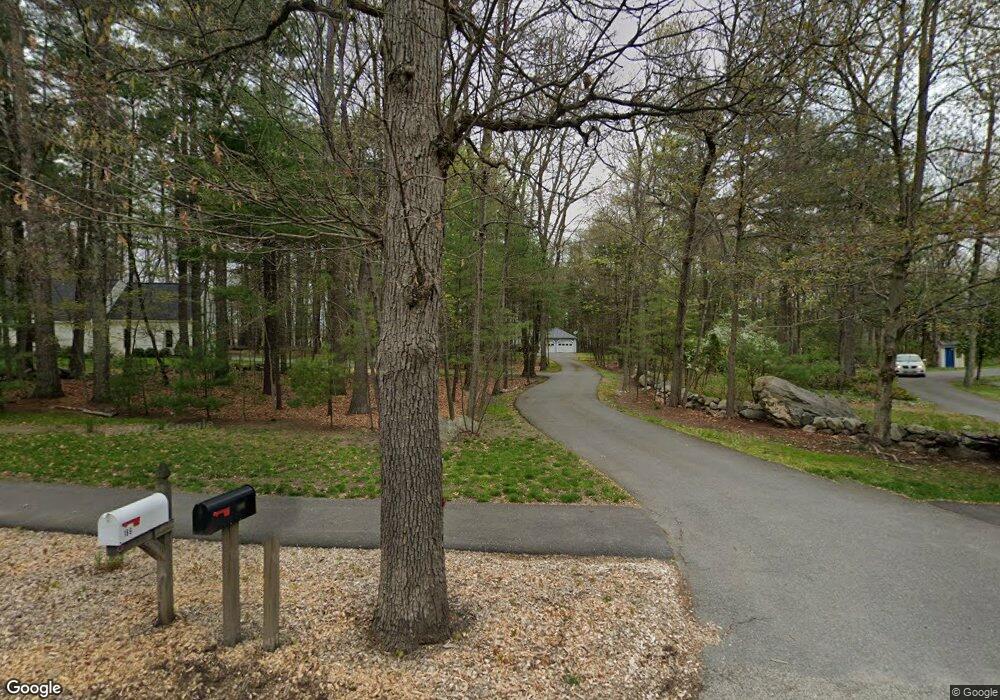
This home is located at 190 High St, Acton, MA 01720 and is currently estimated at $942,375, approximately $523 per square foot. 190 High St is a home located in Middlesex County with nearby schools including Acton-Boxborough Regional High School, Maynard Knowledge Beginnings, and The Imago School.
Ownership History
Date
Name
Owned For
Owner Type
Purchase Details
Closed on
Jul 16, 1999
Sold by
Rowles Brian C and Rowles Elaine M
Bought by
Francis Richard P and Francis Edythe H
Current Estimated Value
Home Financials for this Owner
Home Financials are based on the most recent Mortgage that was taken out on this home.
Original Mortgage
$225,000
Interest Rate
7.39%
Mortgage Type
Purchase Money Mortgage
Purchase Details
Closed on
Jun 22, 1992
Sold by
Lunn & Sweeney Corp
Bought by
Rowles Brian C and Rowles Elaine M
Create a Home Valuation Report for This Property
The Home Valuation Report is an in-depth analysis detailing your home's value as well as a comparison with similar homes in the area
Home Values in the Area
Average Home Value in this Area
Purchase History
| Date | Buyer | Sale Price | Title Company |
|---|---|---|---|
| Francis Richard P | $335,000 | -- | |
| Rowles Brian C | $235,800 | -- |
Source: Public Records
Mortgage History
| Date | Status | Borrower | Loan Amount |
|---|---|---|---|
| Open | Francis Richard P | $193,000 | |
| Closed | Francis Richard P | $220,300 | |
| Closed | Francis Richard P | $225,000 |
Source: Public Records
Tax History Compared to Growth
Tax History
| Year | Tax Paid | Tax Assessment Tax Assessment Total Assessment is a certain percentage of the fair market value that is determined by local assessors to be the total taxable value of land and additions on the property. | Land | Improvement |
|---|---|---|---|---|
| 2025 | $14,329 | $835,500 | $366,900 | $468,600 |
| 2024 | $13,428 | $805,500 | $366,900 | $438,600 |
| 2023 | $13,365 | $761,100 | $334,000 | $427,100 |
| 2022 | $12,674 | $651,600 | $291,600 | $360,000 |
| 2021 | $12,373 | $611,600 | $270,800 | $340,800 |
| 2020 | $11,675 | $606,800 | $270,800 | $336,000 |
| 2019 | $11,300 | $583,400 | $270,800 | $312,600 |
| 2018 | $11,114 | $573,500 | $270,800 | $302,700 |
| 2017 | $10,838 | $568,600 | $270,800 | $297,800 |
| 2016 | $10,648 | $553,700 | $270,800 | $282,900 |
| 2015 | $11,474 | $602,300 | $270,800 | $331,500 |
| 2014 | $11,079 | $569,600 | $270,800 | $298,800 |
Source: Public Records
Map
Nearby Homes
- 132 Parker St Unit G5
- 128 Parker St Unit 3B
- 118 Parker St Unit 16
- 1 Maillet Dr
- 12 Brewster Ln
- 2 Clover Hill Rd
- 128 Audubon Dr
- 25 Main St
- 70 River St
- 40 High St
- 86 School St
- 71 School St
- 7 King St
- 20 Tremont St
- 2 & 6 Powder Mill Rd
- 69 Powder Mill Rd
- 8 High St Unit G1
- 66 Powder Mill Rd
- 8 Laurel Ct
- 96 Forest Ridge Rd Unit 96