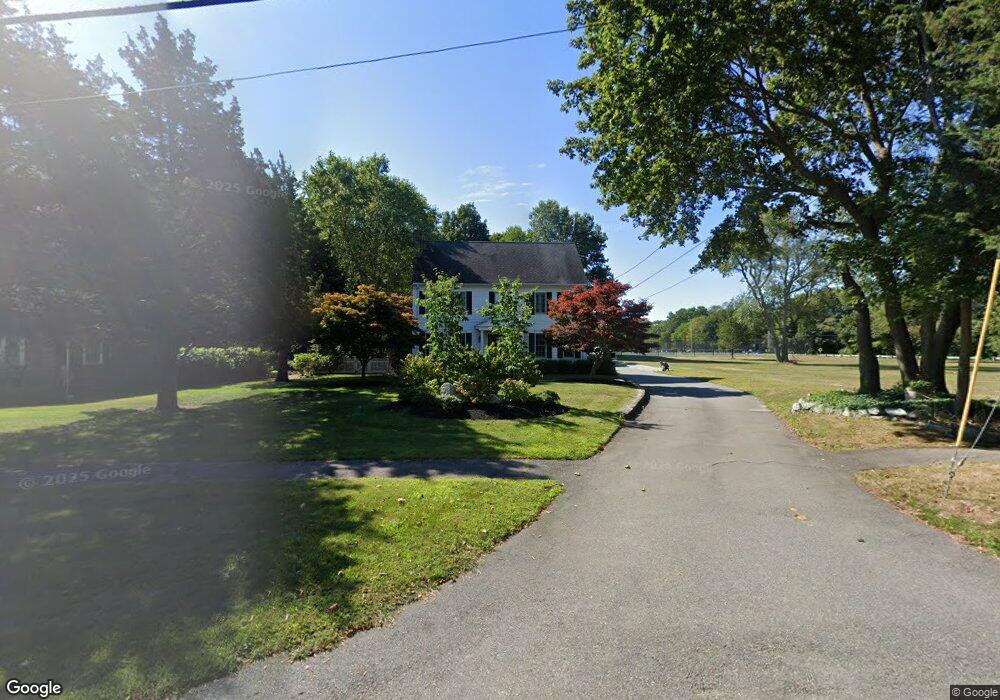
190 High St Hingham, MA 02043
Estimated Value: $1,262,000 - $1,614,170
3
Beds
4
Baths
3,031
Sq Ft
$483/Sq Ft
Est. Value
About This Home
This home is located at 190 High St, Hingham, MA 02043 and is currently estimated at $1,463,043, approximately $482 per square foot. 190 High St is a home located in Plymouth County with nearby schools including Plymouth River Elementary School, Hingham Middle School, and Hingham High School.
Ownership History
Date
Name
Owned For
Owner Type
Purchase Details
Closed on
Dec 28, 2000
Sold by
High St Rt and David Stephen T
Bought by
Macdonald Michael J and Macdonald Nancy H
Current Estimated Value
Purchase Details
Closed on
Apr 4, 2000
Sold by
Michelson Charles L
Bought by
High St Rt and David Stephen T
Create a Home Valuation Report for This Property
The Home Valuation Report is an in-depth analysis detailing your home's value as well as a comparison with similar homes in the area
Purchase History
| Date | Buyer | Sale Price | Title Company |
|---|---|---|---|
| Macdonald Michael J | $565,000 | -- | |
| High St Rt | $190,000 | -- |
Source: Public Records
Mortgage History
| Date | Status | Borrower | Loan Amount |
|---|---|---|---|
| Open | High St Rt | $417,000 | |
| Closed | High St Rt | $25,000 |
Source: Public Records
Tax History Compared to Growth
Tax History
| Year | Tax Paid | Tax Assessment Tax Assessment Total Assessment is a certain percentage of the fair market value that is determined by local assessors to be the total taxable value of land and additions on the property. | Land | Improvement |
|---|---|---|---|---|
| 2025 | $14,518 | $1,358,100 | $443,700 | $914,400 |
| 2024 | $13,870 | $1,278,300 | $443,700 | $834,600 |
| 2023 | $12,061 | $1,206,100 | $443,700 | $762,400 |
| 2022 | $11,321 | $979,300 | $382,700 | $596,600 |
| 2021 | $11,080 | $939,000 | $382,700 | $556,300 |
| 2020 | $10,827 | $939,000 | $382,700 | $556,300 |
| 2019 | $10,670 | $903,500 | $382,700 | $520,800 |
| 2018 | $10,634 | $903,500 | $382,700 | $520,800 |
| 2017 | $9,858 | $804,700 | $369,600 | $435,100 |
| 2016 | $9,830 | $787,000 | $351,900 | $435,100 |
| 2015 | $9,647 | $769,900 | $334,800 | $435,100 |
Source: Public Records
Map
Nearby Homes
- 249 High St
- 9 Cranberry Ln
- 2 Black Rock Dr Unit 21
- 2 Black Rock Dr
- 6 Brewer Way
- 38 School St Unit 2
- 31 School St
- 38 Smith Rd
- 86 Black Rock Dr
- 10 Colby Rd
- 22 Linscott Rd
- 178 Hersey St
- 21 S Bradford Rd
- 38 Twilight Path
- 43 Filomena St
- 955 Pleasant St Unit 11
- 15 Lewis Ct
- 7 Lewis Ct
- 425 East St
- 14 Old Stone Way Unit 11